


Transaction data, hotel bookings, value shoppers, booze hounds, student borrowers . . . we got it all
- checking in on the Almighty Consumer, tariff uncertain, or nay?
- transaction data says: ‘same as it ever was,’ hotel bookings, too
- value shoppers and ‘squeezed’ low-income shoppers? we got those
- maybe it’s the tax refunds?
- an unexpected correlate to Big Box sales growth
- e-commerce is doing something incredible
- student loans and the impact to credit scores
- which employees do the booziest brunches?
It’s been a week or so since The Great Tariff Uncertainty Crisis hit fever pitch, and it’s been a week or so since it continues to be all sizzle, no steak:
WSJ headlines are a pretty representative sample of what the hivemind was hollering about.
Consumers were (supposedly) on a razor’s age, as tariff uncertainty loomed like a cloud, and recession was nigh.
As Random Walk meticulously laid out (in a series of posts), little-to-none of the actual data supported the panic. Outside of some pretty obviously weather-related noise towards the end of February, everything seemed pretty OK. There are certainly plenty of things to worry about, but none of them new, and therefore no reason to think that we wouldn’t keep-on-keeping-on, just as we did before.
Whatever “downturn” is/was in the offing, it’s the same steady “downturn” that’s been going on for over a year. As best as I can tell, the Great Tariff Uncertainty Crisis is mostly fake.1Is it possible there’s yet some other shoe to drop? Of course. And business spending and investment is a much harder thing to observe (but there too, the data is mixed, and certainly not uniformly gloomy).
But anyways, how does it look ~1 week later?
Pretty much the same, it turns out.
Consumers are spending
Are consumers slowing down?
Well, let’s take a look at some spending data:
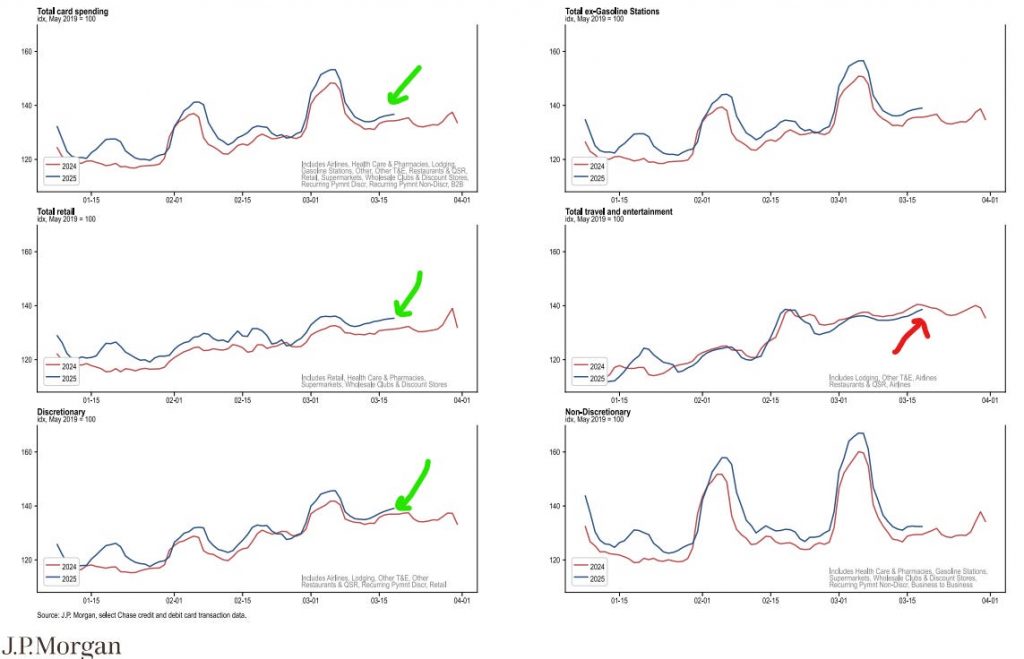
Total consumer spending, retail and discretionary, are all trending above last year.
So, consumers appear to be spending money, pretty much as per usual. Even “travel and entertainment” looks like it’s on the verge of catching back up, but that’s really the only category that’s taken a hit.
If total consumer spending is slightly higher than last year, that’s not exactly screaming crisis, now is it.
Travel too?
And even re. travel—where there was some particularly suspect hollering—there’s at least some data that indicates that’s pretty ok, too:
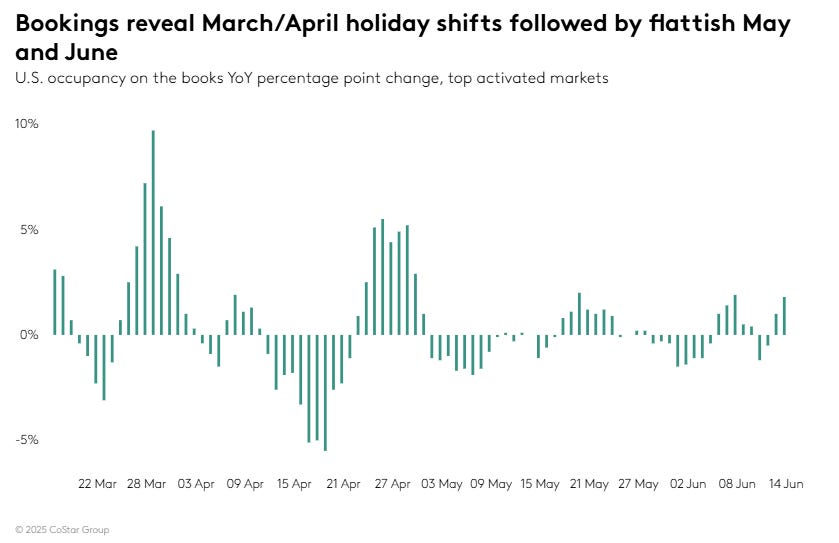
Advance hotel booking are a bit up, and then down, and then up.
It’s almost like the slight seasonal shifts in when the holidays land is creating some strange yoy comps, but otherwise, the picture looks pretty OK.2
Value-shopping and trade downs (and the lowest-income shopper)
Dollar General DG 0.00%↑ said the lowest income shoppers are getting squeezed, and higher income shoppers are trading down to value.
I’m sure that’s true. But it’s been true since at least the beginning of 2024, and probably longer. Cautious Consumerism has been, and continues to be, the new normal. We are all Walmart shoppers, now.
Look at spending growth for General Merchandise (i.e. big box retailers) by income bracket:
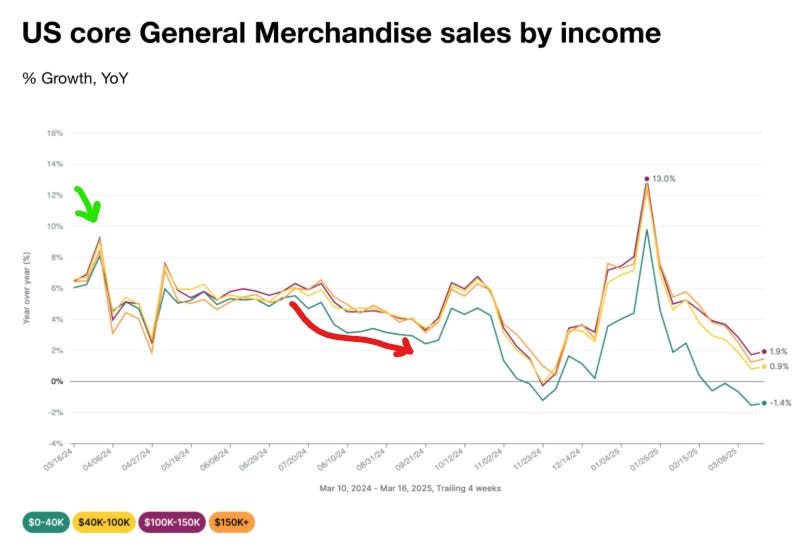
The lowest-income bracket has gone negative yoy!
So yes it’s true that lower income shoppers are getting squeezed, but the general downward trend dates back to the Spring of 2024, which is also when the lowest income shoppers began to diverge.
But the big-box retailers in general? Outside of Target, they’re fine:
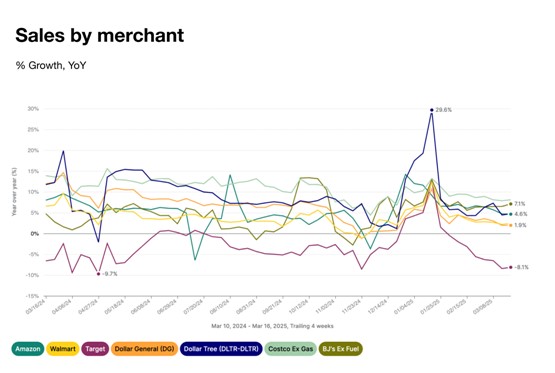
Gently slowing growth for pretty much everyone (except Target).
Target is bad at life, but we already knew that.
Once again, whatever this is, it’s not a new phenomenon. If you got faked-out by that ridiculous seasonal spike over the holidays, well, that’s on you.
Is it the tax refunds?
I did find one bit of evidence to throw some cold water on “everything is (just as) fine.”
Where might some of this spending resiliency be coming from? Is it real, or is there something transient?
Well, it could be a little extra something from Uncle Sam:
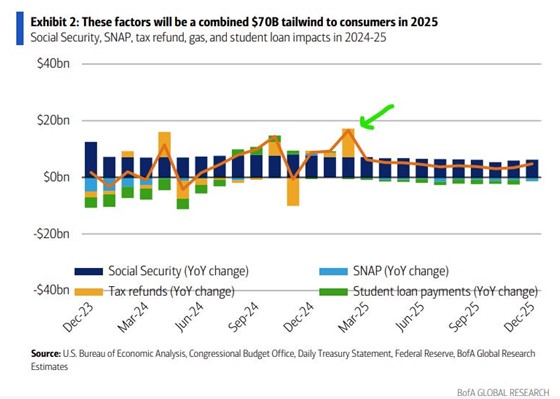
BofA
The Almighty Consumer got a big fat tax-refund in the beginning of the year.
A tax refund could certainly help, and between that, and social security cost of living increases, BofA estimates an additional $70B of consumer purchasing power, courtesy of unborn taxpayers. That $70B includes some anticipated drag from student loan repayments (and more on that below).
Idk, could tax refunds be hiding some unseen stress? Doesn’t seem likely, but could be. I figured I’d include it for completeness sake.
Bigger picture, though, the story remains the same: the Almighty Cautious Consumer keeps on plugging. The speedy catch-up of yester-year has been slowing for a while, and the new-normal is what it is.
It’s not the most inspiring picture, but it’s no more uninspiring than it was ~12 months ago.
Other consumer sundries
Just some quick-hitters that I picked up in my travels.
Target, Walmart, and New Home Sales?
Speaking of Target and Walmart, a brief digression.
Did you know that new home sales have a 70% correlation with Walmart $WMT and Target’s $TGT sales growth?
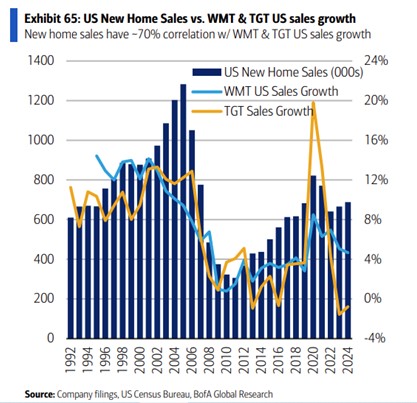
New home sales go up, so too do sales at walmart and Target (and when they go down, so do the big boxers).
Given Target’s recent behavior, I suspect that relationship has broken a bit, but who knew? It makes sense though—people-growth is TAM-growth (for both homebuilders and retailers). Everyone wants the stork on its side.
e-commerce is doing all the cooking
The continued growth of e-commerce (especially as a retail-driver) is old ground around these parts.
Buying cheap tchotchkes on the internet, has been the hallmark of the Almighty Cautious Consumer. That we knew. What I did not know (or failed to appreciate) is just how central e-commerce spending has been to the growth story.
Perhaps I’m misinterpreting this, but not only is brick n’ mortar spending trending below last year, it’s basically at the same place as it was in 2019:
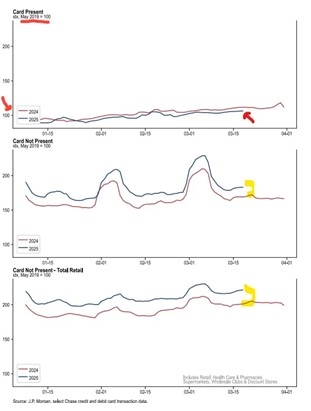
JPM
“Card not present” is ~2x what it was in 2019, while “card present” is stuck at 100 (indexed to 2019).
If that’s correct, it’s (a) incredible that brick n’ mortar spending has not increased, at all, but (b) e-commerce is responsible for the entirety of consumer spending growth. Again, it’s pretty hard to believe, so I’m inclined to think I’m making a mistake here, but I’m not sure what that mistake might be.
Perhaps it’s Apple Pay wanding that’s being counted as “card not present?” That could be.
Student groans
With student loans now back in repayment, the NY Fed took a little look at how it’s going.
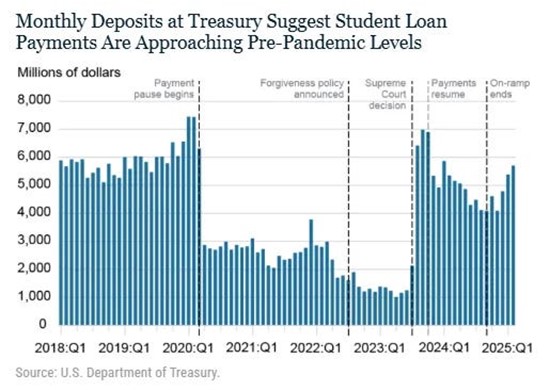
It’s going pretty well, insofar as repayments appear to be returning to the status quo ante.
The downside is that all the student borrowers who were in default before(but then got un-defaulted), may well go back into default. So what does that look like?
It means ~9M borrowers are back on the naughty list:
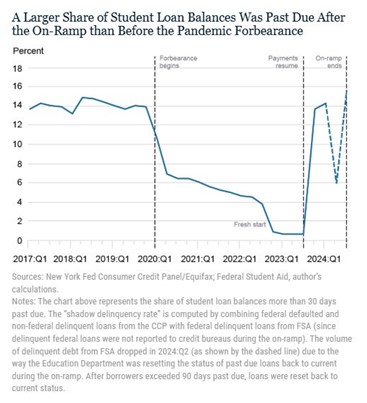
The share of student loans past due is ~16%, which is slightly higher than before the forbearance began.
And what will happen to those ~9M credit scores if they don’t get back into compliance?
They go down, sometimes by a lot:
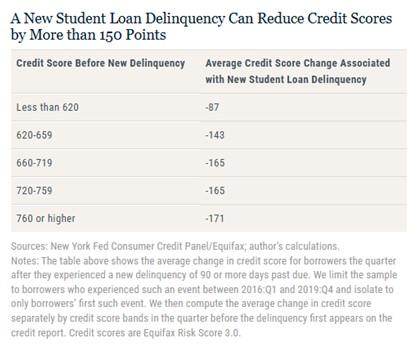
A new delinquency can move scores downwards from 87 points to as much as 171 points (on average).
Given these estimates, we expect to see more than nine million student loan borrowers face substantial declines in credit standing over the first quarter of 2025.
The aggregate impact on overall credit access due these declines in credit scores will depend on the previous credit standing of those with past due loans. If missed payments come largely from those with lower scores, the aggregate impact will be smaller because those with low credit scores will see smaller declines and already have relatively limited credit access.
However, if prime and superprime borrowers fell behind on student loan payments, the aggregate drop in credit standing among student loan borrowers could be much larger. This would result in reduced credit limits, higher interest rates for new loans, and overall lower credit access.
That would have a non-negligible impact on consumer spending, for sure. Good for BNPL, though.
People are drinking less, but if you need to get soused, call marketing
I just found this amusing, mostly for how it conformed to stereotype.
According to Ramp, alcohol’s share of corporate food n’ drink spending fell from 13.9% to 12.5%.
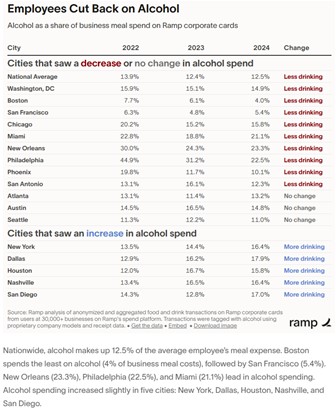
Only 5 cities experienced a relative increase in alcohol’s share of corporate card spending, but the rest were either flat or down.
Philly(?!) especially appears to be going dry, and that’s nothing like the Philly I used to know.
OK, so take this data with a grain of salt (because all data should be taken with a grain of salt, but there’s probably a bit more noise than usual), but less-drinking generally conforms to the overall “dry” inclinations that have been fashionable of late.
Fine so far as it goes, but this is fun part.
If you want to go out drinking, this is who you get working-meals with:
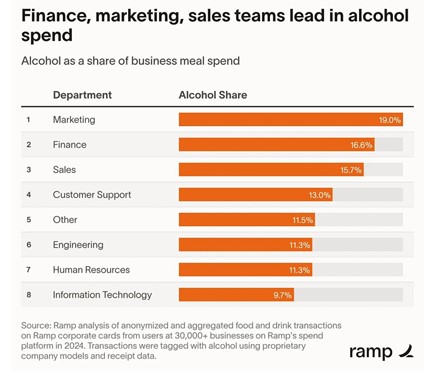
The marketing team spends the most on booze by far(as a share of spending).
Marketing is followed by finance and sales in a distant second and third. HR is unsurprisingly bringing up the second-to-rear, and the “Information Technology” nerds are in dead last.
Probably too busy microdosing to bother with drinking.³
Originally published by the Random Walk and reprinted here with permission.


