


Rents rising the quickest, first-time buyer supreme, CRE lightening round.
- money in the cheap seats
- first-time buyers in crisis (lol, no)
- CRE lightening round
- love that dirty water
- CMBS delinquencies getting . . . better?
- commercial foreclosures getting . . . worse?
- mistakes were made
- Bonus: FHA mortgages getting hairy, and There is No Housing Shortage, Student Housing edition
Money in the cheap seats
Where is rent growing the quickest? It’s gotta be those super-unaffordable metros where no one is ever allowed to build, right?
Well, no. It’s the opposite of that.
The fastest rent-growth is in the cheapest zip codes:
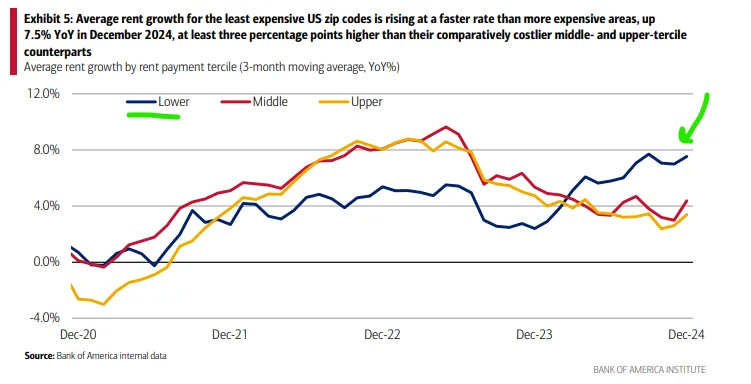
The lowest tercile of zip-codes has been growing rents the quickest for about a year.
Why rents are growing most quickly from the bottom-up is hard to say, but presumably that’s where the demand is, relative to the supply.
Does Almighty Cautious Consumerism apply to housing, as well? I suppose it might. Plus, if a larger chunk of new entrants into the apartment market happen to be lower-income—e.g. migrants—that could have an effect, as well. Or maybe more people are living alone, which means carrying 100% of the rental cost, which might increase demand for bargains.
Another possibility for why less-expensive zips are in (relatively) high demand is just the ongoing shift to cheaper parts of the country.
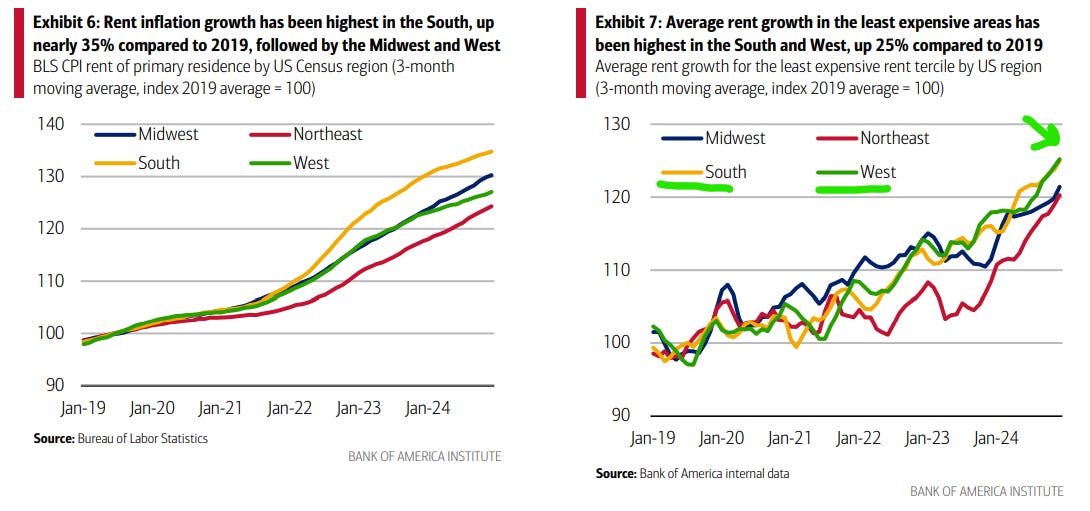
The South has been both the great migration winner and the rent-growth winner.
For low-cost zips specifically, the South and the West have been running together (but the Northeast and Midwest aren’t that far behind).
Interestingly, the relative out-performance of lower-tercile zip codes is mostly a Western and Northeastern-driven phenomenon:
The West especially has seen faster rent-growth in the least expensive areas.
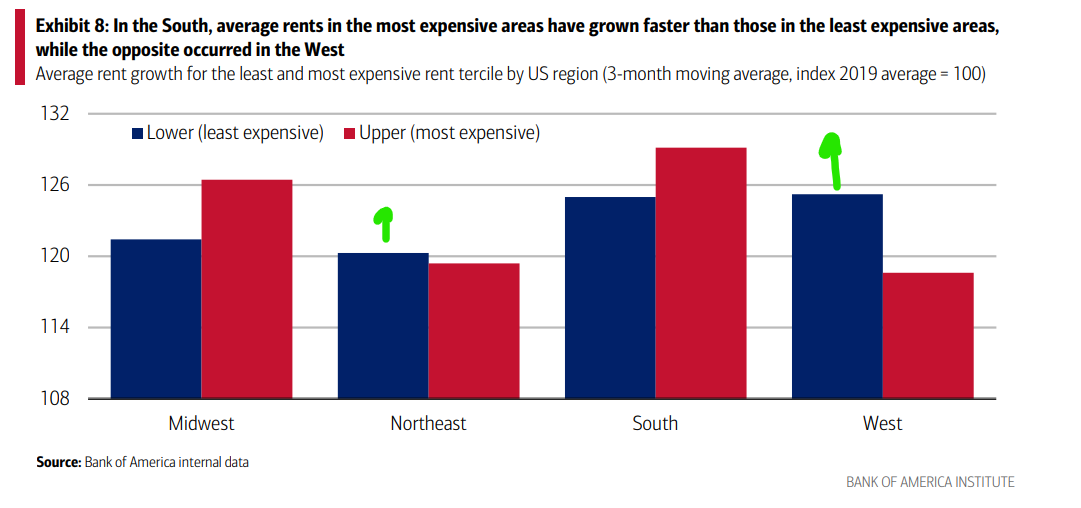
The South has rent-growth that’s nearly as fast, but it’s even faster for more expensive Southern zips. In other words, the South has experienced relative demand shifts everywhere, whereas the West (and Northeast) appear to have concentrated gains in the lower-cost neighborhoods.
From an anecdata standpoint, the growth of lower-cost zips in the Northeast is consistent with e.g. the out-performance of inventory-constrained neighborhoods like New Haven or Rochester, both of which have a hospital system as the anchor employer, and a corresponding growth of “workforce” (i.e. lower-income) housing.
Oh, and of course, the other evergreen point to make is that shelter-pricing is obviously sensitive to changes in demand. Southern rents are rising the quickest, and I don’t think anyone would even try to claim “it’s because of the zoning throttling new supply.”1
First-time homeowners own the market
Contrary to popular belief, first-time homebuyers are an increasingly large share of the home-buying market:
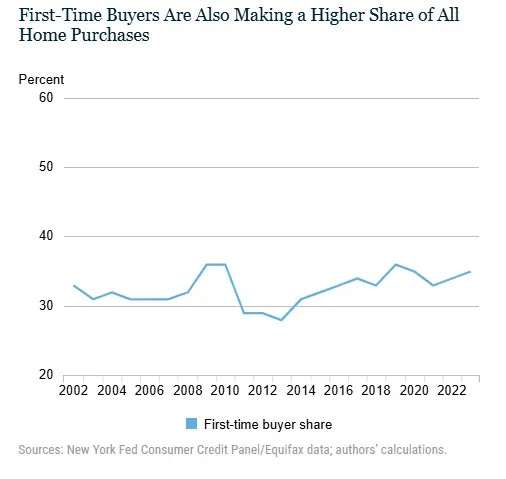
The share of first-time homebuyers is approaching the series high.
In fact, FTB have been on an upward trend of homebuying share since 2013.
FTBs are an even larger share of the mortgage market—because a lot of homebuyers are all-cash, at the moment:
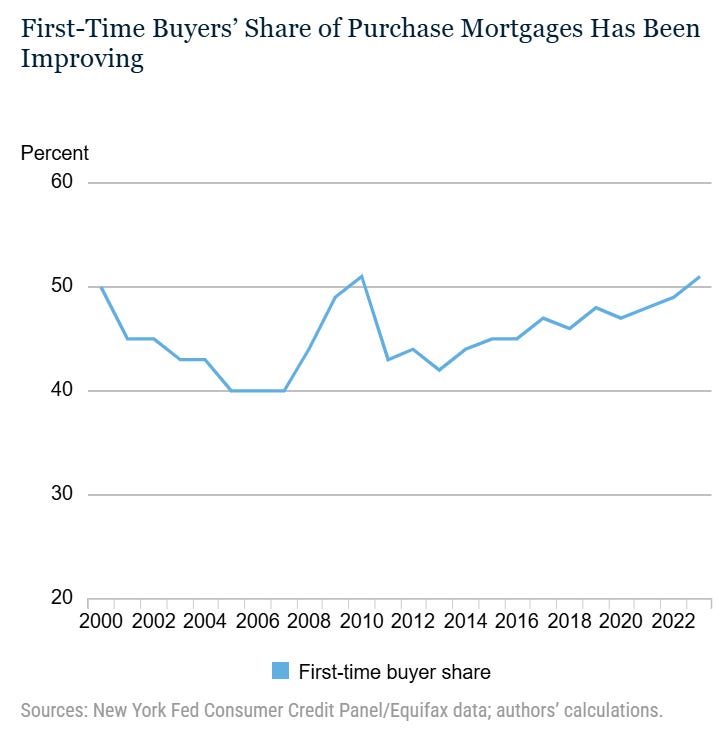
First Time Buyers are now more than half of the mortgage market, which is as high as it’s been since . . . nevermind.
It’s kind of a fun observation, because the research team at the NY Fed explicitly set out to debunk this variant of the “housing crisis” claim.
“Based on recent proposals and policy dialogue, it would appear that first-time home buyers (FTB) are indeed facing desperate times. For example, in a recent Urban Institute study [researchers] advocate for a zero-downpayment Federal Housing Administration (FHA) mortgage . . . to help households transition to homeownership given the challenges of high house prices and mortgage rates.
“. . . The National Association of Realtors (NAR) in its 2024 report Profile of Home Buyers and Sellers states that FTBs represented only 24 percent of home sales . . . the lowest in the history of their data reporting going all the way back to 1981. Similarly, NAR finds that the typical FTB was 38 years old—7 years older than normal. . . .
“Regarding the NAR statistics described in the previous paragraph, they are based on their annual survey . . . However, only 6,817 completed surveys were received back indicating a response rate of just 3.6 percent.”
NY Fed calling out the Urban Institute and NAR for using bad data as part of a pitch for more homebuyer subsidies is pretty funny.2
So, are FTBs in the cat-bird seat? No, not really.
Of course, what’s likely going on here is that FTBs are the people who need to buy houses, which is to say they’re the only ones buying houses, at all.
Remember, no one is moving:
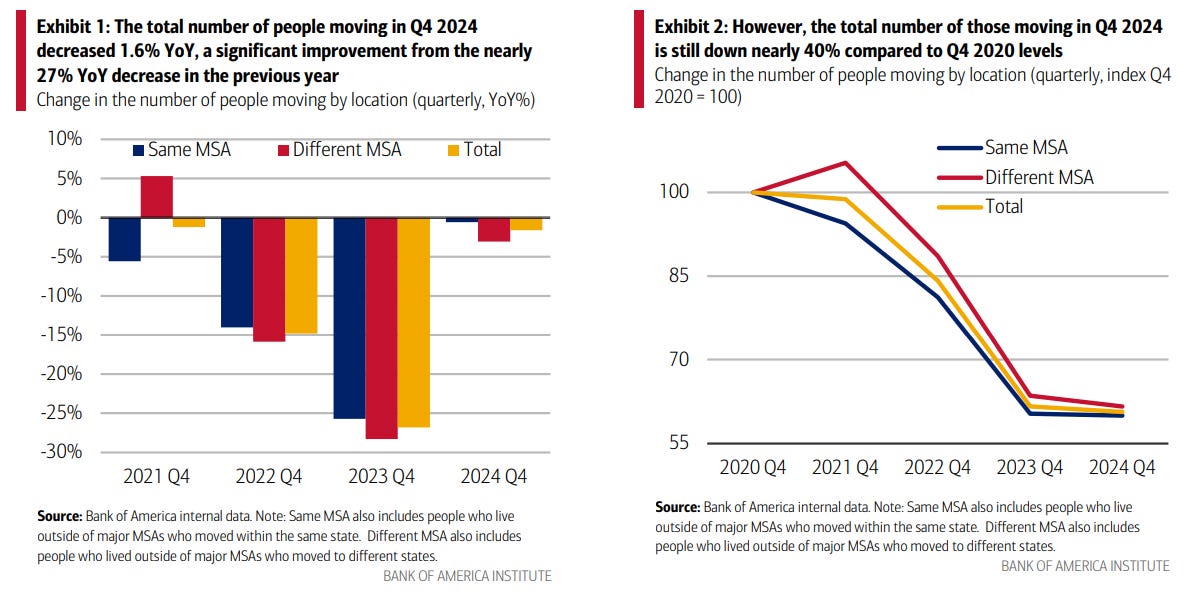
The total number of movers is ~60% of what it was in 2020.
If you already have a house, you’re not buying a new one at prevailing listing prices because those listing prices reflect the unreasonable expectations of unmotivated sellers (exactly like you). You also don’t want to sell your house at the lower prices that the market can actually bear.
So, second-time buyers aren’t going anywhere, period.
That leaves the first time buyers, as really the only motivated buyers out there, because they’ve got no asset-value to lose.
Commercial lightening round
A few quick hitters from the CRE side of things.
CMBS delinquencies heading . . . down?
For the first time in forever, the CMBS delinquency rate went in the right direction:
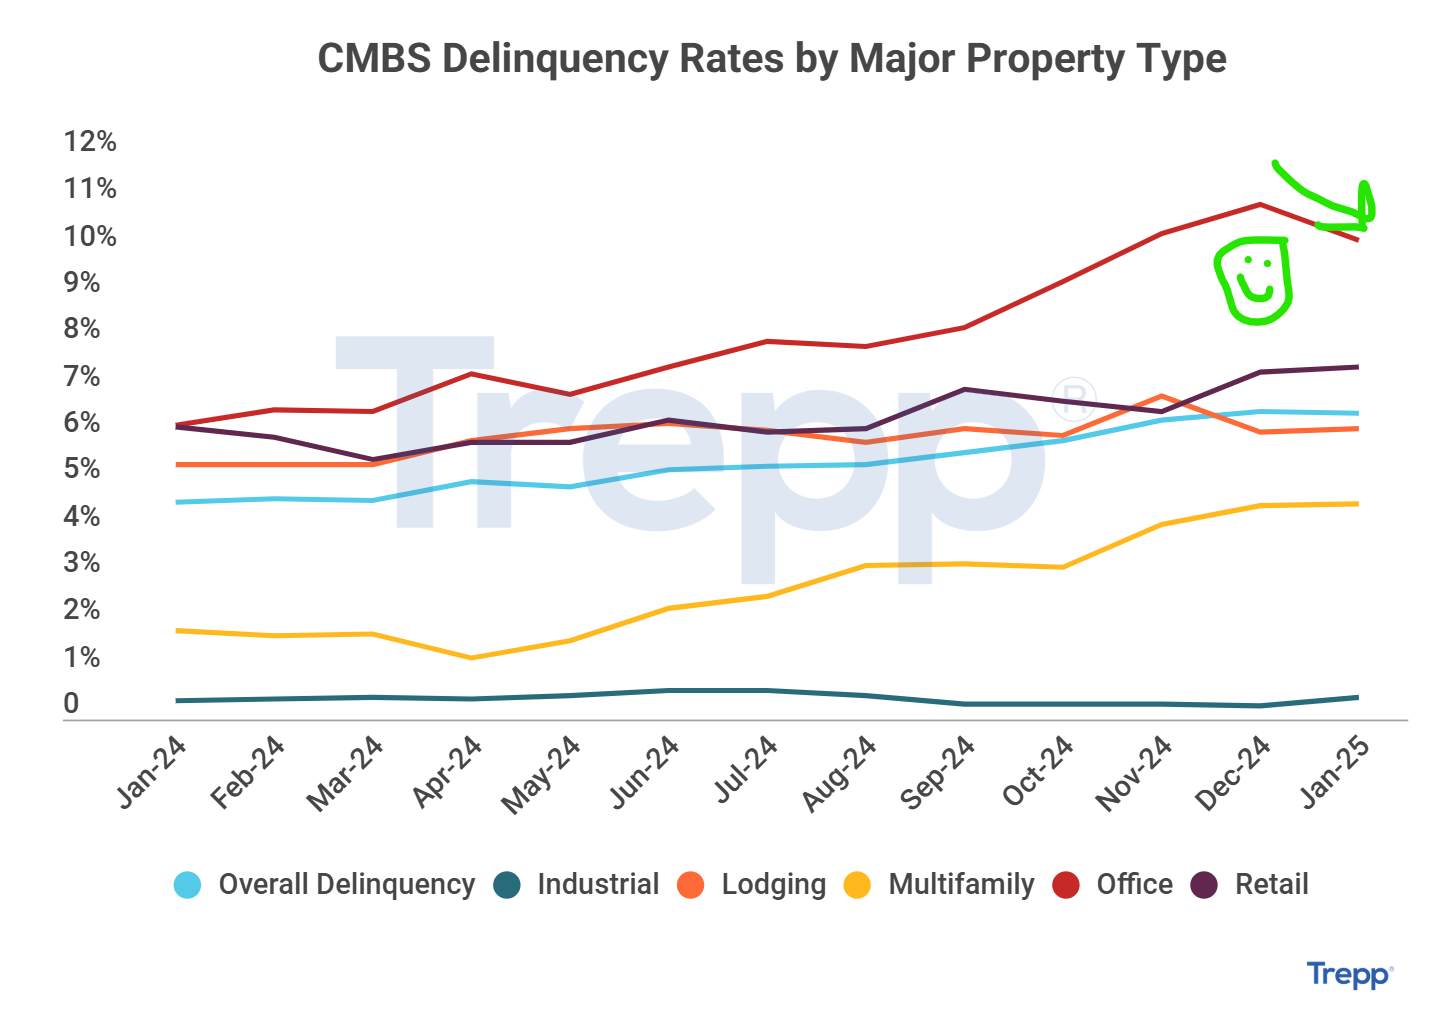
Office CMBS delinquency rates declined (finally) off their sky-rocketing peak.
Random Walk has unsuccessfully tried to call the bottom a few times (and here), but maybe this time it’s really here? Or it could just be a prevalence of year-end work-outs and foreclosures bringing the delinquency rate down for a moment.
Commercial foreclosures heading . . . up?
It’s probably not a coincidence that commercial foreclosures surged at the end of the year:
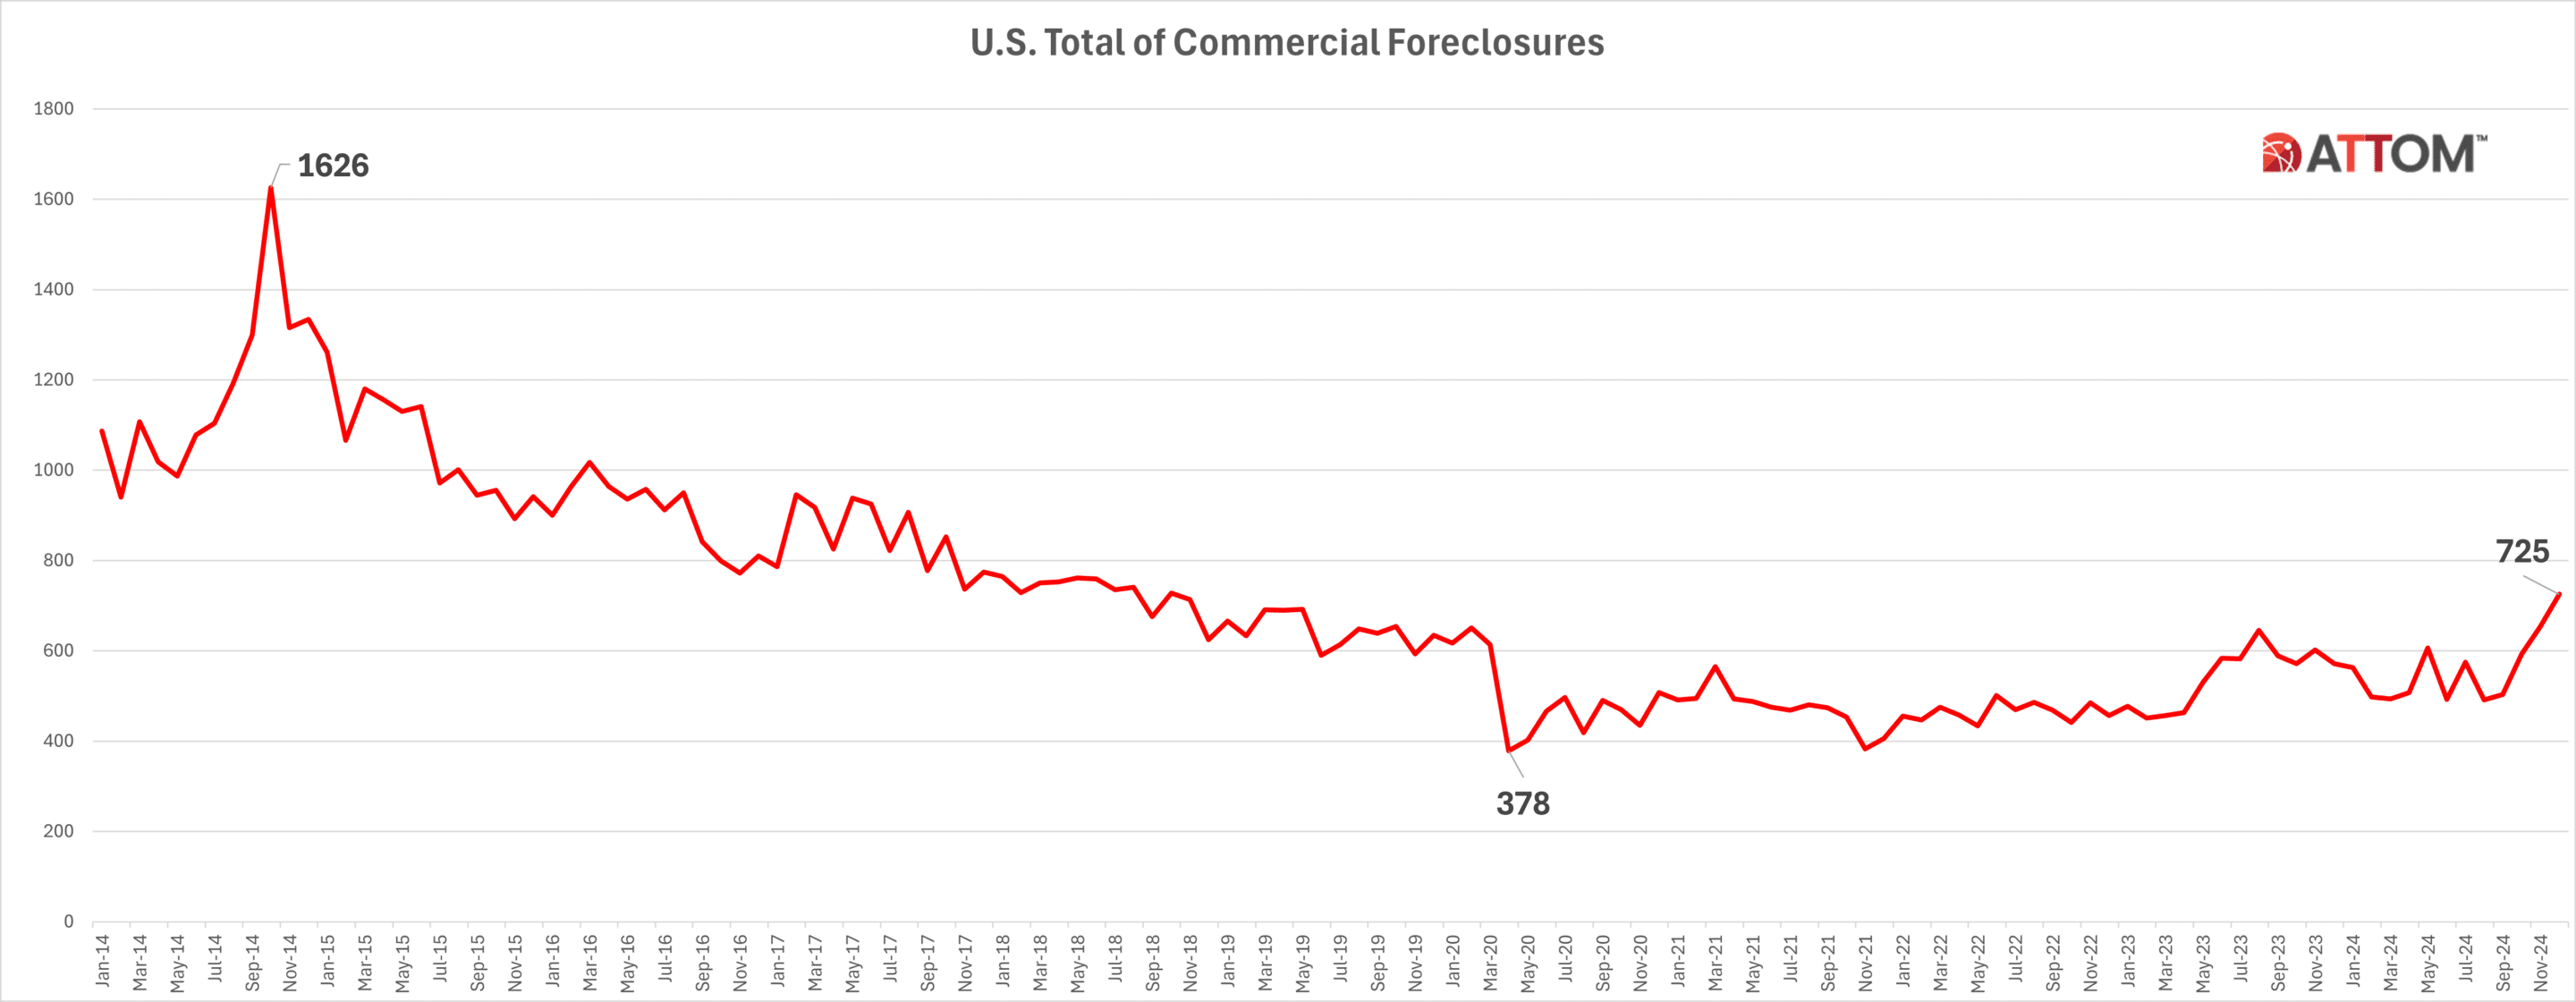
Foreclosures peaked (by count) in December
Again, when lenders decide to take back the property, that’s a decent sign that they think the property is now worth owning, either to sell or to operate.
Foreclosures also increase price-discovery (when there are sales), which can be self-reinforcing (in a good way), if price-discovery gives lenders the confidence that the bottom is nigh.
Mistakes were made
It’s hard to imagine the kind of credit package that would earn you a 6%+ rate in 2021, but those definitely happened:

~$10B in 6%+ Freddie mortgages in 2021, a year when money was otherwise basically free.
I genuinely wonder what the borrowers did to deserve those rates.
In any event, presumably those loans have blown-up by now, but you never know. Also, not that it’s a secret, but 2024 was a tough year to get a loan for multifamily developers.
Love that dirty water
Do you know what city has the most office construction in pipeline?
It’s Boston:
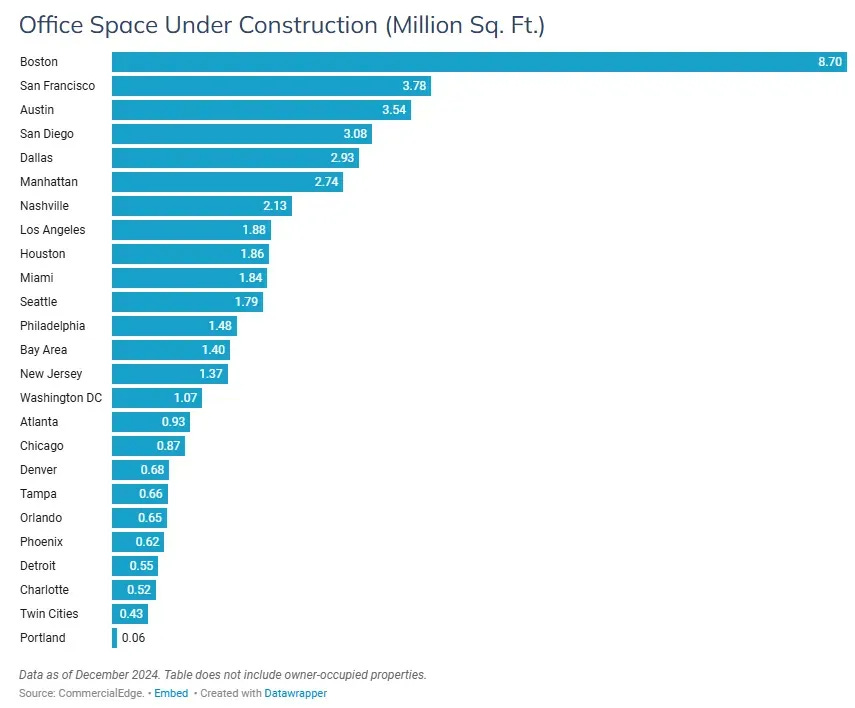
With 8.7M square feet under construction, Boston has more than twice as much office in pipeline as the next highest city (SF).
Boston also has one of the faster growing vacancy rates in the country, as well:
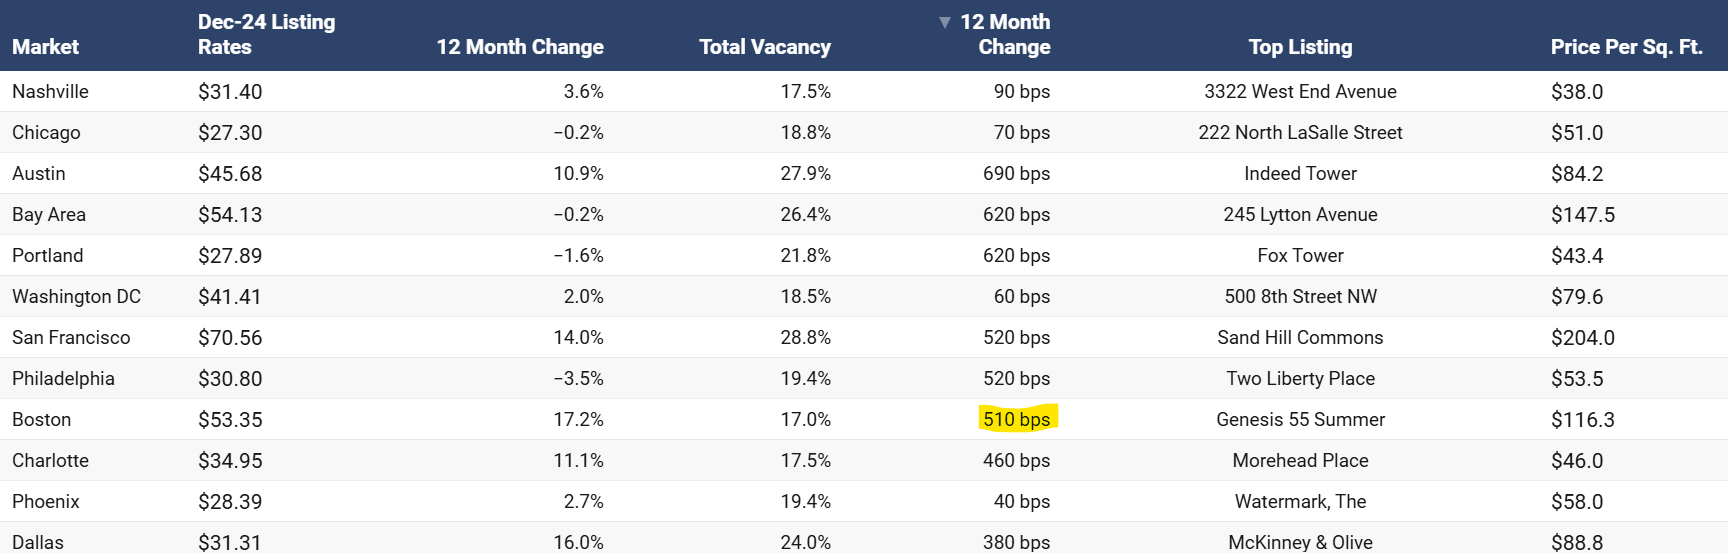
Boston’s office vacancy rate has increased by 5.1 percentage points yoy, which is the 9th highest change in the country.
Adding a lot of new inventory to rising vacancy rates is normally a setup most developers would prefer to avoid. Of course, Boston’s listing rates have increased by 17%, and are among the Top-5 most expensive office spaces in the country, so it’ll be fine, probably.
But man, that’s a lot of office space. Presumably a lot of labs and biotech, stuff.
This article was originally published in The Random Walk and is republished here with permission.


