Originally published October 2021.
A decade to be optimistic?
Somewhere amid the carnage of the retail sector, the existential navel-gazing of the office sector and the irrational exuberance of sheds, meds and beds (where investment yields are vanishing as quickly as the chances of Arsenal ever winning the Premier League again in my lifetime), there lies an uncomfortable truth: the listed sector, in absolute terms, is going, well, broadly nowhere in terms of size, and relative to Europe and the rest of the world is declining significantly. Clearly the ‘glory days’ of the late 80s, when the UK listed real estate market was larger than the US are not going to return, but is it realistic that the UK might return to closer to the 10-15% of the global market that it once represented compared to the current 5%? The answer is yes, but possibly not in the way that might first be imagined.
There are four questions to answer:
Is this a cyclical downturn in relative size or a structural rebalancing?
What are the factors that drive a market’s growth?
How big could the sector be?
Where might that growth come from?
Cyclical or structural?
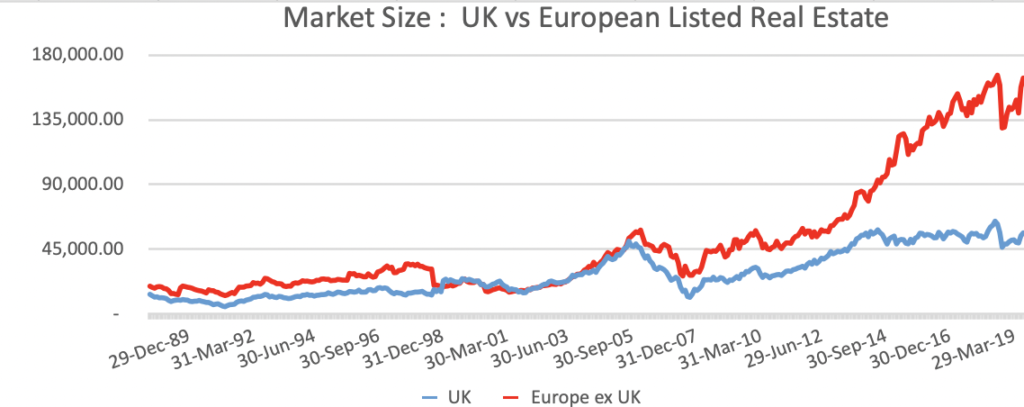
Chart 1 shows how the UK and Europe ex-UK listed real estate markets have grown in absolute terms since that glorious night at Anfield in 1989. The pattern is easily discernible – Europe was marginally larger in the 1990s. Pre-GFC they were of similar size – the GFC affected the UK more due to greater capital value declines in the underlying market (c -44% plays c -20%), but it is in post-GFC that Europe has pulled away. Driven, it must be said, predominantly by the popularity of German residential as a sector and the aggressive Pac-Man acquisition strategy of Vonovia in particular. The facts, however, are undeniable. From parity pre-GFC, the UK is now around one-third of the size of the European listed real estate sector.
Chart 1. market size: UK vs European listed real estate

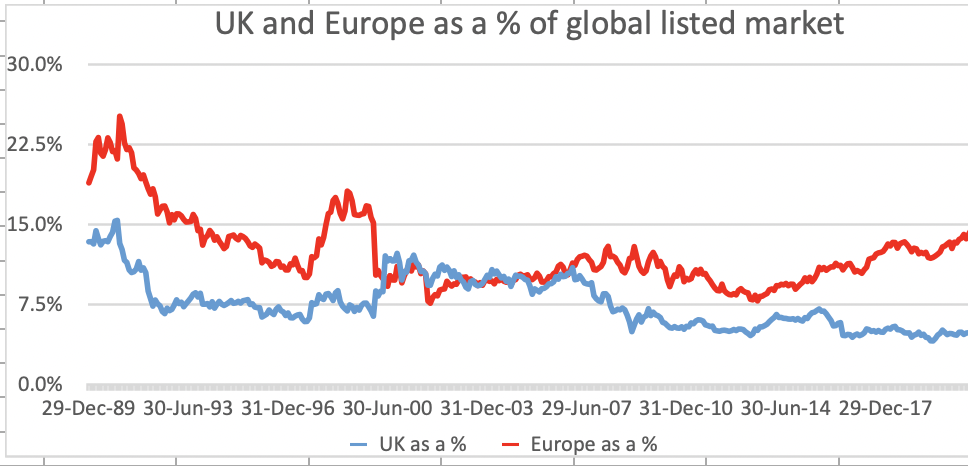
So is this purely a European growth story or is it a UK decline narrative? The answer is a bit of both. Chart 2 looks at the UK and Europe in terms of size relative to the global listed real estate market. As can be seen, from equality pre-GFC, the UK has halved in relative size from 10% to 5%, while Europe has grown from 10% to 15%.
Chart 2. UK and Europe as a % of global listed market

What drives a market’s growth?
Back in 2012 we wrote an article for EPRA entitled ‘Growing the European listed real estate market’, looking at the factors behind the relative decline and asking whether lessons could be drawn from the explosion of the US REIT market post-1992 to anticipate/promote a resurgence. The factors we identified were:
The level of ‘equitisation’ of the CRE market domestically.
Valuation methodologies.
Regulatory changes.
The level of investible stock requiring a transfer of ownership.
Institutional underweights.
So taking these points in turn:
1. Equitisation. We define this as the size of the listed sector relative to the size of the underlying CRE market. NB This understands the listed size dramatically as the metric is free float market capitalisation, not gross assets, but it is applied consistently across all countries. So, how does the UK compare? Table 1 below shows some key markets for perspective:
Table 1

As can be seen in the UK, the listed represents around 6% of the total CRE market (before taking into account leverage and valuation impacts), which is not dissimilar to the European figure of 7%. However, it falls way short of the US and Asia Pac numbers of 13% and 16%. This is partly due to legacy issues of DB vs DC pension schemes and the dominance of the unlisted sector, but with the move towards regular liquidity/pricing requirements, it seems reasonable to assume that there is scope for more of the CRE market to be in a listed equity format. The other key takeaway from this table is that the UK does not have a paucity of numbers of listed vehicles, but the problem is that the average market capitalisation is low (US$1.04b vs US$5.02b in the US).
2.Valuation methodologies. One of the key issues historically has been the fixation with NAV and anchoring equity issuance around this metric. In the US there are two key advantages which help fuel listed company growth. A lack of pre-emption rights and a valuation system based on AFFO multiples rather than discount/premium to NAV. As a result there is not only greater pricing elasticity, but a wider pool of investors available and a shorter timetable to market. While pre-emption rights and NAV anchoring are unlikely to disappear, it is worth noting that selected sectors have now been trading at a premium and raising equity capital easily for a while. In addition, the Covid crisis and material uncertainty clauses have led to a greater focus on valuing cash flows rather than simply a third-party estimate of capital value at a point in time, and further advances in this area would undoubtedly help the growth/fund-raising prospects of the sector. The reason this is a possibility lies in the fact that virtually all assets (ex long leases to [quasi] Govts) are now seen as ‘operational’ to a greater or lesser extent and therefore a multiple of cash-flow valuation approach may be more appropriate.
3. Regulatory changes. It remains to be seen whether the FCA consultation has a material impact upon the supply and demand for unlisted funds, a favoured choice for real estate exposure by wealth managers and individuals. However, any regulatory move towards daily pricing/liquidity to accompany market preferences from platform providers could be seen as a plus for the sector.
4. Investible stock in the wrong hands. One of the key factors behind the sector’s growth in the US in the early 90s, post-Savings and Loans crisis, and Ireland and Spain post-GFC, was the amount of high quality stock held by the wrong owners, ie, banks who had taken over the assets in foreclosures. These assets needed to be repackaged from an unwilling to a willing holder, ie, equity holders, either listed or unlisted. In the current market there is a significant number of retail assets which are in this category, although it is noted that repurposing the offering from retail to mixed use, and indeed having tenants that pay rent will be required before the exit to the listed sector could take effect.
5. Institutional underweight. At present we are not aware that any institutional investors are involuntarily underweight in the sector in aggregate. They are, however, underweight in certain sub-sectors, be it industrial or residential, hence the weight of money chasing yields down. One of the things the listed sector has always been good at providing is an aggregator for popular sectors which it is possible to gain exposure to, be it big boxes (Tritax), student accommodation (Unite), healthcare (PHP) or indeed in the US life sciences, data centres, cell towers, etc.
We therefore believe there is the possibility of a resurgence in the UK sector over the next decade, not necessarily in terms of numbers of companies, not necessarily all REITs, and certainly not in diversified/average portfolios, but specifically for companies that can provide exposure to sectors or income streams which are not easily accessible elsewhere, and in a liquid and cost effective form.
These could include:
‘New’ sectors: eg, life sciences, data centres.
Investment solutions: eg, visible long-term cash flows as income producing inflation hedges.
Non-REIT structures: eg, genuine operational real estate opportunities, where there is a technological/IP/first mover advantage, eg, PropTech companies and finite life funds.
Repositioned old sectors: eg, fully functioning repositioned erstwhile retail assets.


