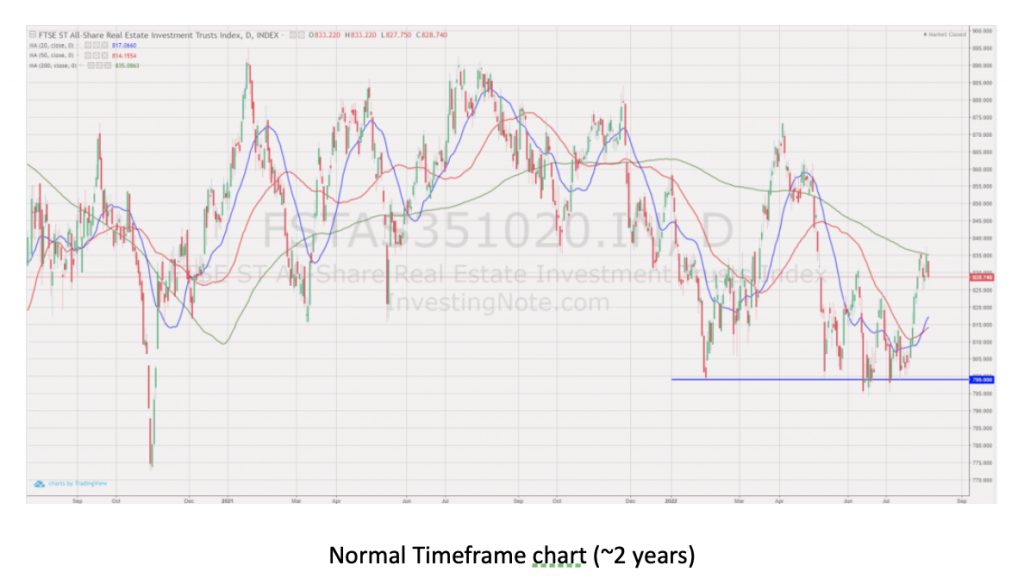
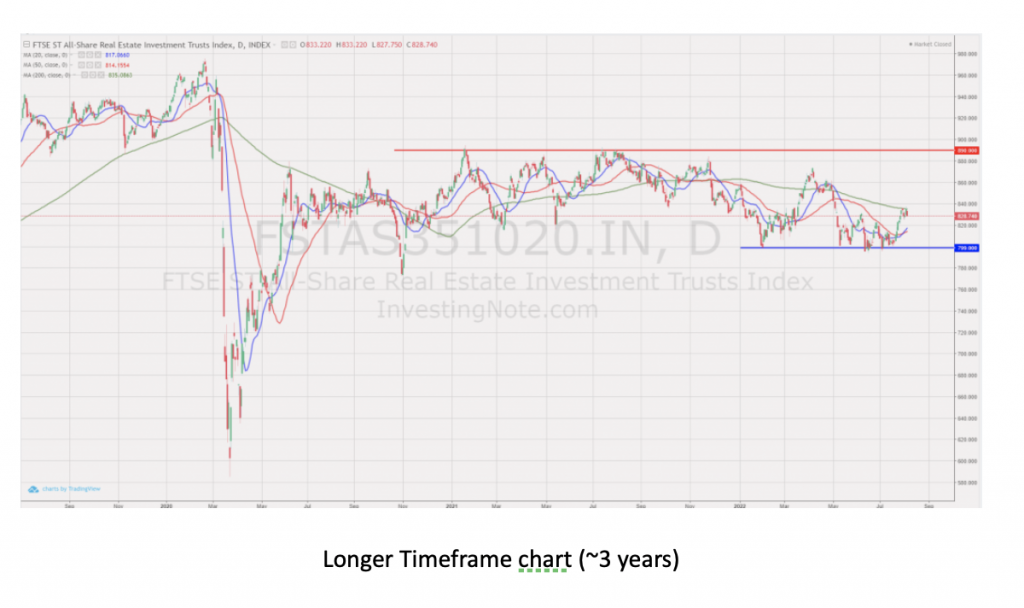
- FTSE ST Real Estate Investment Trusts (FTSE ST REIT Index) decreased from 807.47 to 828.74 (2.63%) compared to last month’s update. The REIT Index has reversed to a short-term uptrend, with the 20-day and 50-day Simple Moving Average (20 SMA and 50 SMA) now on an uptrend. The 200 SMA has acted as a resistance for the past 10 days. However, these are small changes as the REIT Index is still moving on a sideways direction in the long-term (see 2nd chart below).
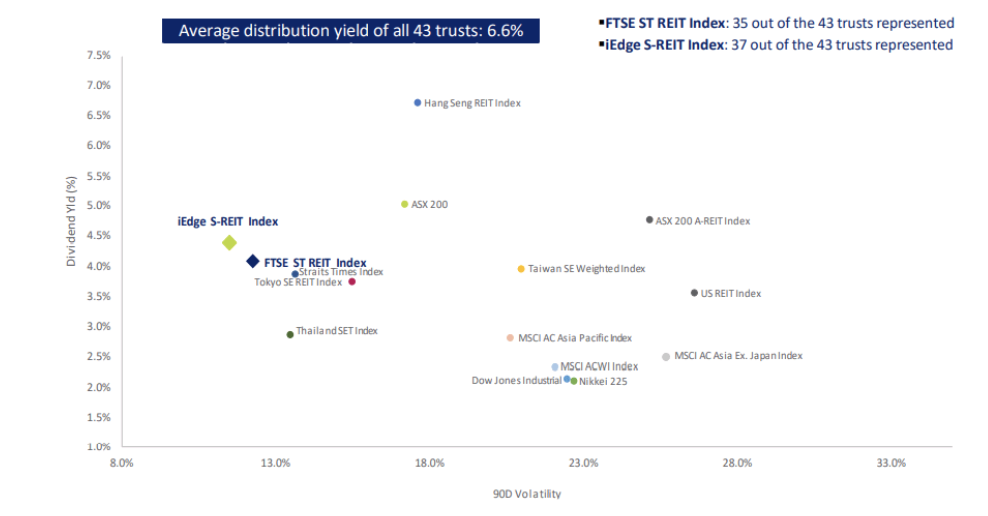
- Yield spread (in reference to the 10 year Singapore government bond of 2.63% as of 7th August 2022) widened from 3.47% to 3.67%. The S-REIT Average Yield increased slightly from6.30% to 6.32%,while the decrease in the Government Bond Yields more than offsets this Average S-REIT Yield increase. This resulted in the widening of yield spread. The yield of the REITs sector needs to increase to maintain the average yield spread of 4%. S-REITs have been resilient and have one of the highest risk-adjusted dividend yields compared to other stock exchanges.
SREITS offer one of the highest dividend yields and lower volatility

Technical analysis
- Technically, FTSE ST REIT Index has started a short term uptrend but is currently testing the 200 SMA resistance. Longer term wise the REIT index is still trading in a sideways consolidation range between 800 and 890. The index has to break the 890 resistance convincingly before declaring the “The Returning of the Bull in S-REITs”.Support Lines: Blue
- Resistance Lines: Red
- Short-term direction: Up
- Medium-term direction: Sideways
- Long-term direction: Sideways
- Immediate Support at 800, 20 SMA, 50 SMA
- Immediate Resistance at 200 SMA


Fundamental Analysis of 38 Singapore REITs
The following is the compilation of 38 Singapore REITs with colour-coding of the Distribution Yield, Gearing Ratio and Price to NAV Ratio.
Price/NAV Ratios Overview
- Price/NAV increased to 0.94.
- Increased from 0.92 from July 2022.
- Singapore Overall REIT sector is undervalued now.
- Take note that NAV is adjusted upwards for some REITs due to pandemic recovery.
- Most overvalued REITs (based on Price/NAV)
- Parkway Life REIT (Price/NAV = 2.01)
- Keppel DC REIT (Price/NAV = 1.44)
- Mapletree Industrial Trust (Price/NAV = 1.43)
- Ascendas REIT (Price/NAV = 1. 26)
- Mapletree Logistics Trust (Price/NAV = 1.20)
- ESR-LOGOS REIT (Price/NAV = 1.12)
- No change to the Top 3 compared to the March to July updates.
- Most undervalued REITs (based on Price/NAV)
- Lippo Malls Indonesia Retail Trust (Price/NAV=0.54)
- BHG Retail REIT (Price/NAV = 0.57)
- EC World REIT (Price/NAV = 0.59)
- ARA Hospitality Trust (Price/NAV = 0.63)
- OUE Commercial REIT (Price/NAV = 0.66)
- IREIT Global (Price/NAV = 0.73)
Distribution Yields Overview
- TTM Distribution Yield decreased to 6.32%
- Decreased from 6.45% in July 2022.
- 14 of 40 Singapore REITs have distribution yields of above 7%. (2 less than last month’s update)
- Do take note that these yield numbers are based on current prices taking into account the delayed distribution/dividend cuts due to COVID-19, and economic recovery.
- Highest Distribution Yield REITs (ttm)
- EC World REIT (11.12%)
- United Hampshire REIT (9.84%)
- Prime US REIT (9.75%)
- First REIT (9.56%)
- Sasseur REIT (9.19%)
- Keppel Pacific Oak US REIT (9.12%)
- Reminder that these yield numbers are based on current prices taking into account delayed distribution/dividend cuts due to COVID-19.
- Some REITs opted for semi-annual reporting and thus no quarterly DPU was announced.
- A High Yield should not be the sole ratio to look for when choosing a REIT to invest in.
- Yield Spread widened to 3.67%.
- Increased from 3.54% in July 2022.
Gearing Ratios Overview
- Gearing Ratio decreased to 36.52%.
- Decreased from 36.83% in July 2022.
- Gearing Ratios are updated quarterly. Therefore some of the following REITs have updated gearing ratios compared to last month (those with Q2 2022 updates)
- Highest Gearing Ratio REITs
- ARA Hospitality Trust (43.5%)
- Suntec REIT (43.1%)
- Lippo Malls Indonesia Retail Trust (42.9%)
- Manulife US REIT (42.4%)
- Elite Commercial REIT (41.9%)
- ESR-LOGOS REIT (40.6%)
- No change to the Top 3 compared to the April to July updates.
Market Capitalisation Overview
- Total Singapore REIT Market Capitalisation increased by 3.48%to S$108.6 Billion.
- Increased from S$104.95 Billion in July 2022.
- Biggest Market Capitalisation REITs:
- Capitaland Integrated Commercial Trust ($14.12B)
- Ascendas REIT ($12.59B)
- Mapletree Pan Asia Commercial Trust ($10.05B)
- Mapletree Logistics Trust ($8.48B)
- Mapletree Industrial Trust ($7.20B)
- Frasers Logistics & Commercial Trust ($5.28B)
- MPACT (formerly MCT) moved from 5th to 3rd rank since its merger with MNACT.
- Smallest Market Capitalisation REITs:
- BHG Retail REIT ($267M)
- ARA US Hospitality Trust ($357M)
- Lippo Malls Indonesia Retail Trust ($377M)
- First Trust ($444M)
- EC World REIT ($445M)
- United Hampshire REIT ($477M)
38 Singapore REITs at a glance: REIT Table
- The Financial Ratios are based on past data and there are lagging indicators.
- The Financial Ratios are based on past data and there are lagging indicators.
- This REIT table takes into account the dividend cuts due to the COVID-19 outbreak. Yield is calculated trailing twelve months (ttm), therefore REITs with delayed payouts might have lower displayed yields, thus yield displayed might be lower for more affected REITs.
- REITs are updated with the latestQ2 2022 business updates/earnings are highlighted in blue, the rest are updated with Q1 2022 business updates/earning.
- Since MPACT started trading, values shown below (except price and market cap) are of MCT.
- MNACT has been delisted, but values are shown below for reference.
What does each Column mean?
- FY DPU: If Green, FY DPU for the recent 4 Quarters is higher than that of the preceding 4 Quarters.If Lower, it isRed.
- Most REITs are green since it is compared to FY20/21 as the base (during the pandemic)
- Yield (ttm): Yield, calculated by DPU (trailing twelve months) and Current Price as of August 6th, 2022
- Digital Core REIT: Yield calculated from IPO Prospectus.
- Daiwa House Logistics Trust: Yield calculated from trailing six months distribution.
- Gearing (%): Leverage Ratio.
- Price/NAV: Price to Book Value. Formula: Current Price (as of August 6th, 2022) over Net Asset Value per Unit.
- Yield spread (%): REIT yield (ttm) reference to Gov Bond Yields. REITs trading in USD is referenced to US Gov Bond Yield, everything else is referenced to SG Gov Bond Yield.


