- Commercial real estate turning a corner?
- CMBS special servicing rates keep rising (and that’s good)
- net-new distress is smaller
- conditions are getting Sloos
- desiderata on REITs, who loaded-up for a mortgage origination binge that wasn’t, permits per capita, and the Fall’s hottest construction material
Commercial real estate turning a corner
Random Walk keeps trying to call the bottom . . . eventually I’ll get it right
CMBS special servicing rates increase
One reason to be optimistic that commercial real estate is turning the corner is that special servicing rates are beginning to rise.
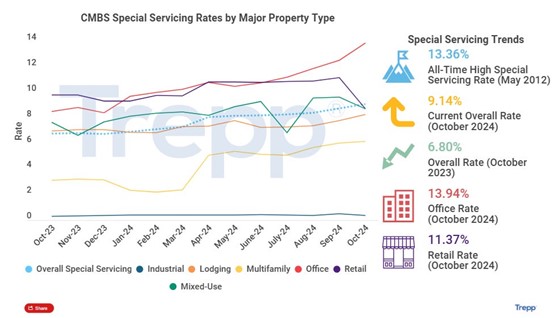
CMBS special servicing rates climbed to 9.14%, with office driving the lion’s share of the increase.
But special servicing is bad. It’s what happens when the borrower falls behind and a third-party comes in to manage things. How can that be a sign of optimism?
Special servicing can be a good thing, if it means that lenders are calling the bottom.
If lenders are reasonably confident that they can find a buyer for the asset, then rather than kick-the-can on underwater loans, lenders will begin to take matters into their own hands. Plus, how much more can-kicking can lenders actually provide? Eventually, you grit your teeth, take your losses, and move on.
So, you see, higher special servicing is a sign of cleaning house, rather than worsening conditions.
Does Random Walk know for a fact that that is what’s happening?
No, I do not. But it’s a theory, insofar, as the dust appears to be settling.
- 10-year rates are relatively stable (around a 4 handle, but stable),
- Class B and C Office isn’t getting better (but it’s not getting worse), and
- new supply has mostly been on ice (to give demand a chance to absorb).
I mean, pretty much everyone (but NY) is pencils-down on multifamily:
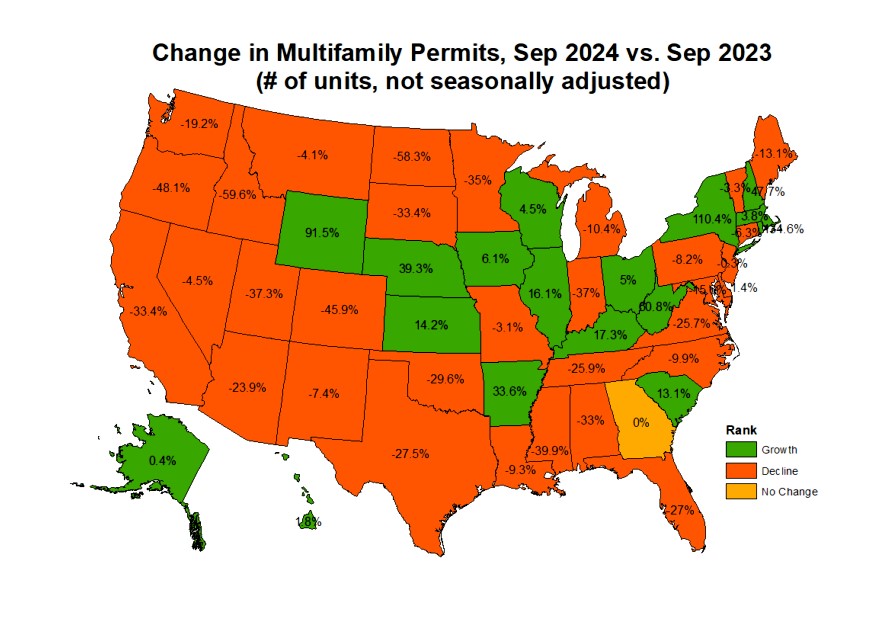
Yoy permitting is deep red negative in all the places that matter except for NY, which has more than doubled since last year.
What better time to start putting money to work, then when the bottom is now in sight?
Net-new distress is smaller
There’s other evidence that the CRE market more generally is bottoming out, as well.
The balance of distressed commercial property loans grew by the smallest amount since rates first went up:
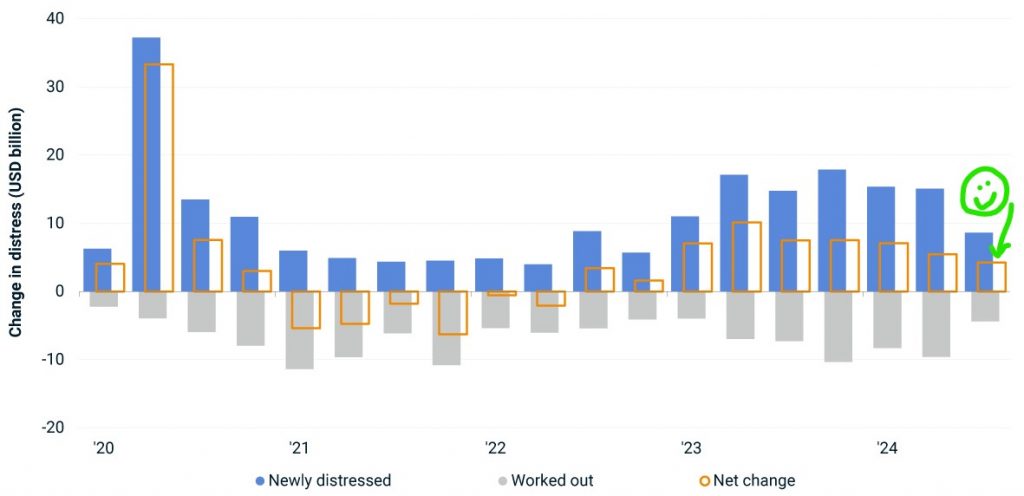
Net “distressed” inflows were a mere ~$5B in Q3.
I mean, it would be better if there were no net-new inflows into distress, but less is better than more. And if there was no net-new inflows, then it would be obvious to everyone that the corner had been turned (and where’s the fun in that).
Office continued to lead the charge in “net new” distressed loans, but for assets like multifamily and retail, net new distress was, in fact, negative (i.e. there were more workouts than new distress).
See, the bottom is nigh (maybe).
Getting Sloose
Here’s yet another reason to be optimistic about reaching bottom.
Underwriting for CRE loans is getting closer to “easing” (albeit still negative):
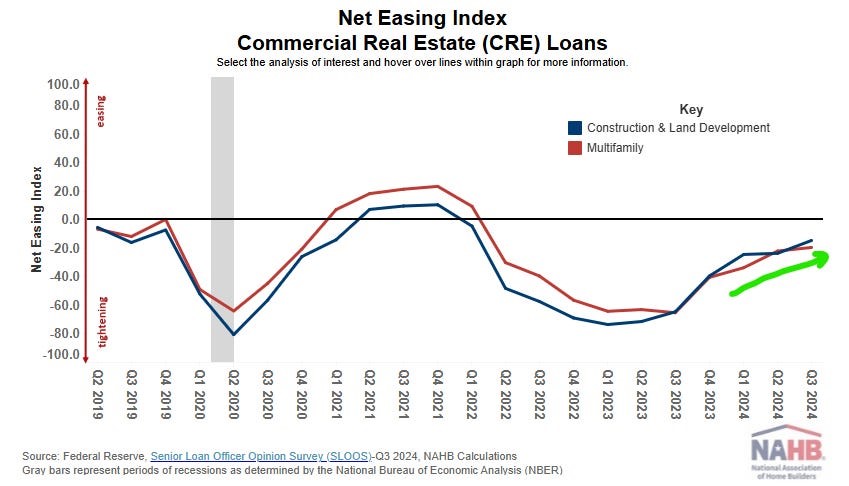
Demand for CRE loans is getting closer to “increasing” (albeit still negative)
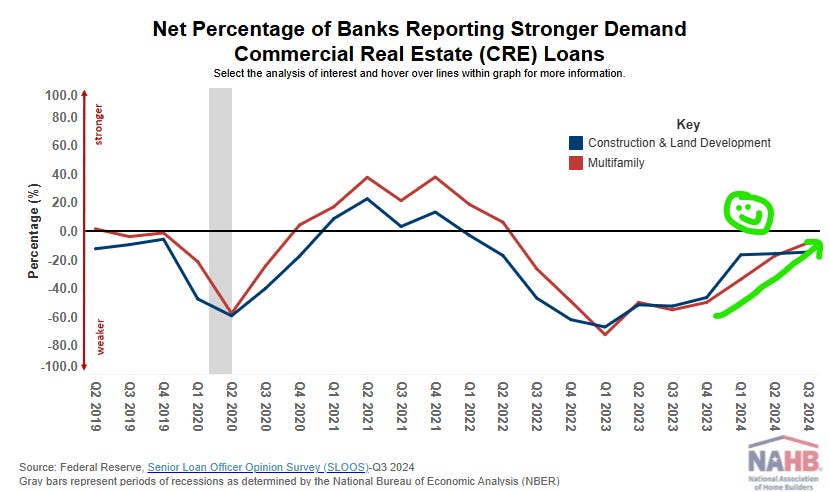
So, banks are still tightening, and borrowers are still less-interested in borrowing, but both trends are heading in the right direction.
Generally, underwriting conditions loosen and demand for loans perk when things are opening up. Both trends are still negative, but they’re on the cusp of positive.
Now, this data lags a bit, so it’s possible that optimism is just an echo from the “jumbo cuts are around the corner” moment a few weeks back, but for now, Random Walk chooses to believe.
Other Real Estate Desiderata
REIT Cuts and Adds
If real estate assets were struggling with cashflows, one place that’d show up would be with REITs.
There was at least one prominent REIT that capped redemptions to staunch the bleeding, but for the most part, things have been pretty manageable.
But, as with most things real estate, “manageable” has not been evenly distributed. Some REITs have done better than others.
Grouped by dividend ratios—or more specifically “are dividends, higher, lower, or the same as they were in 2019”—REITs look like this:
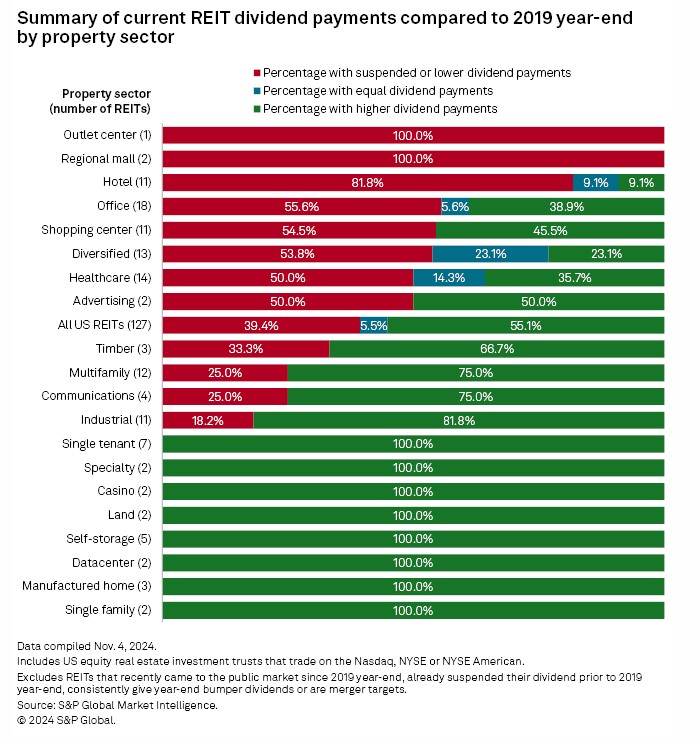
More than half of REITs are paying higher dividends than they were before—even 45% of office REITs are paying as much or more than they were before.
That’s pretty good.
Other than Office doing better than I would have expected, the big board contains few surprises. Hospitality and older shopping centers have struggled (and the always mercurial healthcare), while single-family and data centers (all two of them) do great.
The REITs with the biggest dividend increases tell a similar story
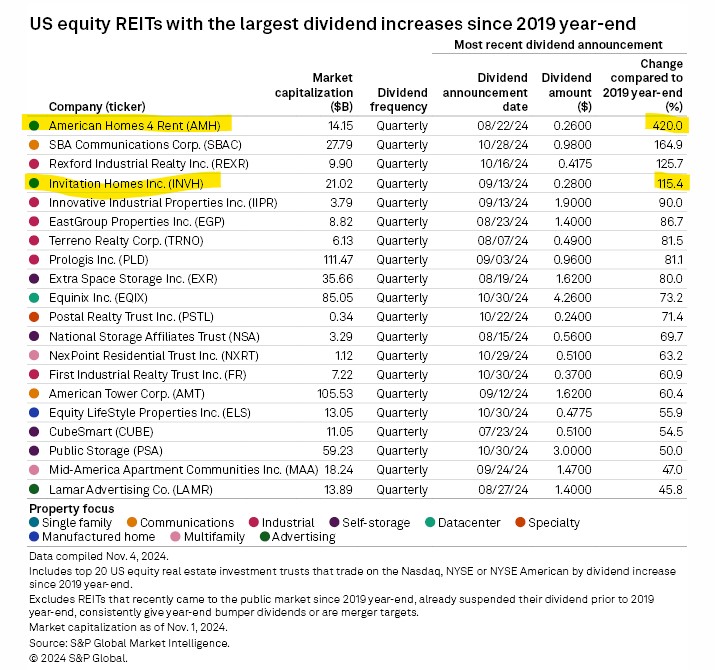
American Homes 4 Rent $AMH has 4X’ed its dividend since the pandemic began (and Invitation Homes $INVH isn’t far behind).
It’s been a good run for single-family and industrial, but you already knew that.
Gearing up for an origination bonanza
At least two mortgage originators were very excited for what they thought were lower mortgage rates.
The number of Mortgage Loan Originators (MLO) at Zillow $Z and Better Mortgage $BETR have increased pretty substantially, every quarter, but especially recently:
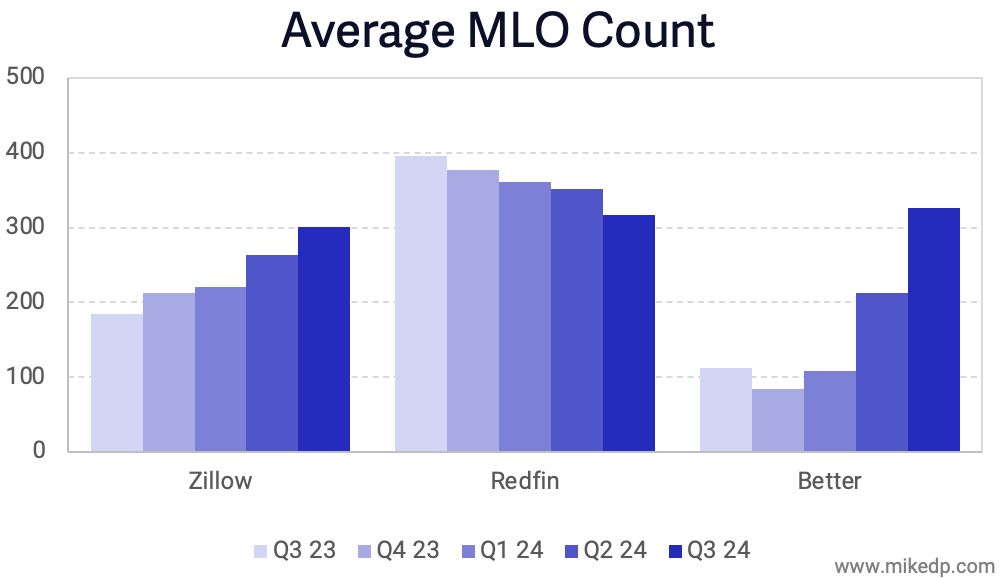
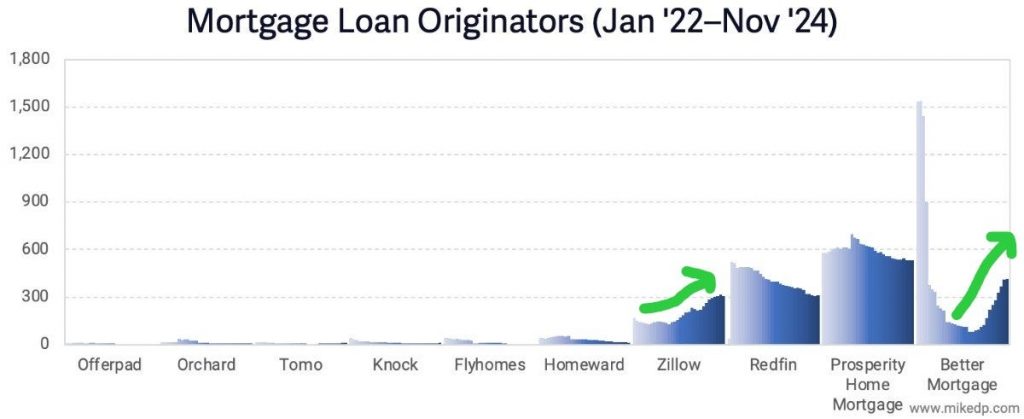
Better mortgage especially has been on an absolute hiring binge, of late.
What it most likely means is that both companies were gearing up for a flood of originations (and refis) ushered in by the low rates that were supposed to be right around the corner. That’s almost certainly what’s going on at the rollercoaster that is Better, but it probably explains a bit of Zillow’s (more consistent) headcount growth, as well.
What happens now that rates are still high? Idk, but hopefully people keep their jobs.
Permits per capita
Are we building too much, too little, or just the right amount of homes?
Longer-term Random Walk readers know that the “housing shortage” is a much more nuanced story than what consensus would have you believe.
Given that population growth has tapered (and will rollover soon), there’s an open question as to whether there’s a shortage, at all. And even if there is a shortage—as a result of post-GFC skittishness, and not NIMBYs—then recently it’s gotten a lot better, and not worse.
I mean, without the totally not-immigration-as-usual, the housing-not-shortage would be even not-shortagier:
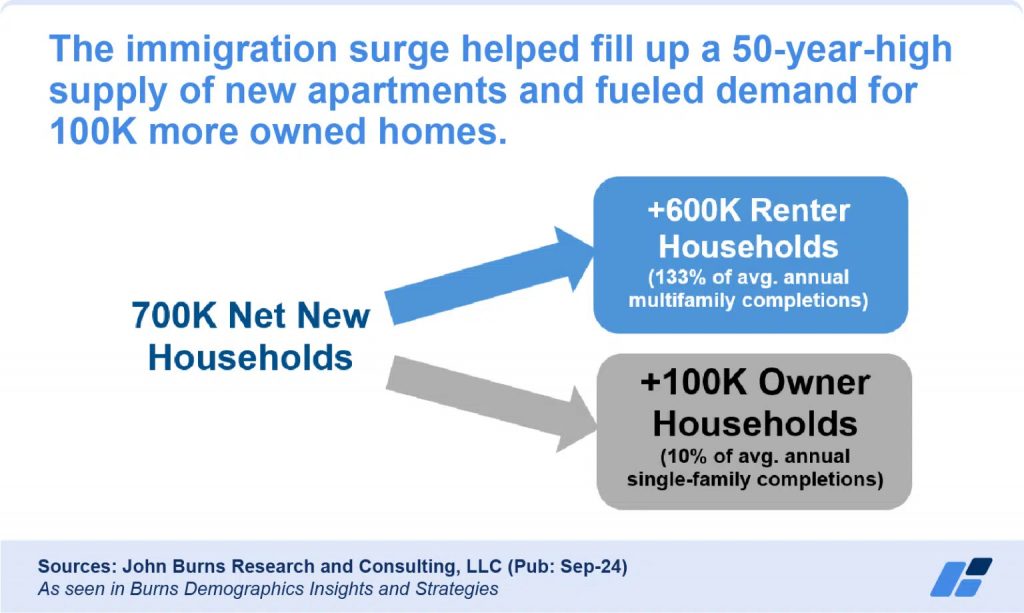
The immigration surge helped fill a 50-year-high supply of new apartments.
JBREC’s words, not mine.
What we know for certain is that anyone who says “we’re in a housing shortage crisis” is playing very fast n’ loose with the facts.¹
Anyways, the latest entry in “there is no housing shortage” are these handy little charts from the St. Louis Fed on permits per capita.
On a national level, permitting is about what you’d expect:
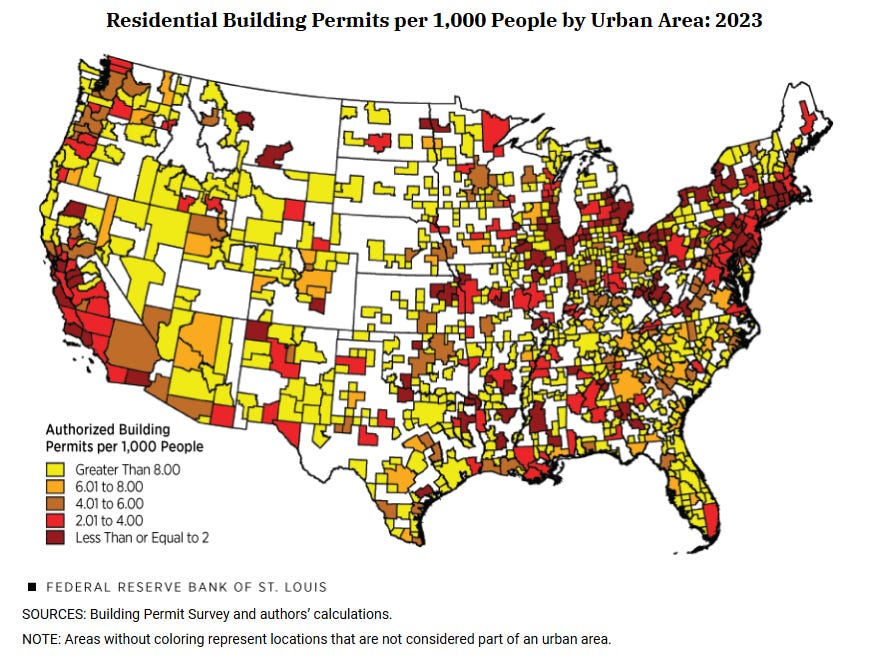
Northeast and West Coast have very few permits, while the growing parts of the country have plenty of permits.
The longer series is also interesting.
From 1980 to the present, permits per capita permitting has ebbed and flowed:
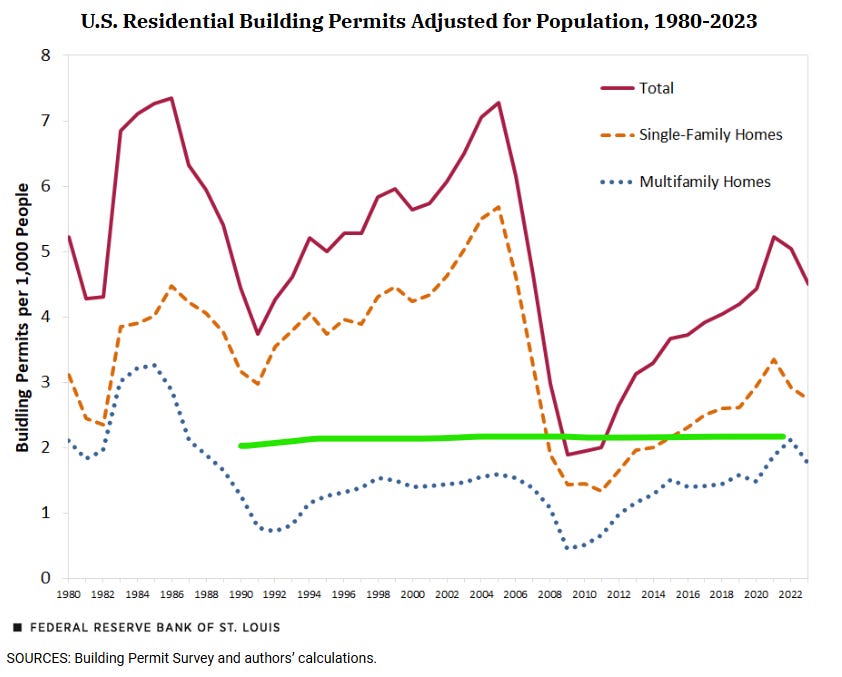
Multifamily permits per capita are considerably higherthan historical levels, while single-family had just about returned to pre-GFC normalcy.
Taken in the aggregate:
[This] analysis has revealed that building permits remain at levels that are around the historical average (1980-2023) of 4.9 per 1,000 people, although slightly lower than they were in the 1980s and 1990s.
Permits per/capita are “around the historical average.”
Sorry, shortage bros, I don’t make the data. I just find it.
Ready-mix concrete is Fall’s must-have item
This is probably nothing, but I found it amusing.
Of all the building materials, there is one that continues to get more expensive more quickly than before:
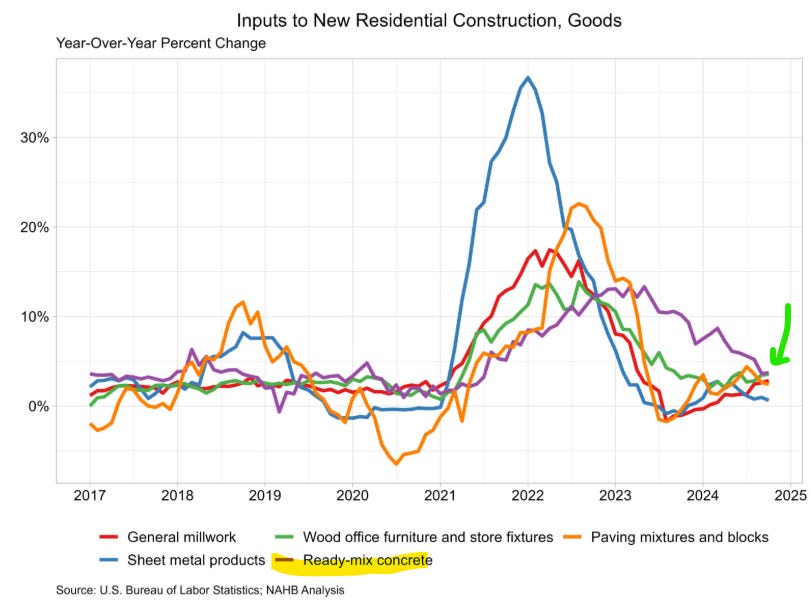
The price of ready-mix concrete is growing just under 4% yoy. “Paving mixtures and blocks” is close behind.
Why are concrete and paving mixture such hot items?
I have no idea. If anyone knows, feel free to chime in in the comments.
This article was originally published in Random Walk and is republished here with permission.


