In this article I will share the three most important financial ratios when analysing and shortlisting REITs. I call them the three musketeers of REITs. The 1st musketeer’s name is Yield, he gives you money; the 2nd musketeer’s name is Gearing, he takes away your money; and the last musketeer is Price to NAV, he decides whether you are getting a good deal.
The technical terms for these three financial ratios are: Distribution Yield, Gearing Ratio and Price to NAV Ratio.
Distribution Yield
For REITs, the common technical term is distribution yield instead of dividend yield. It is very common to see Distribution Per Unit (DPU) Yield in some of the analysts’ reports.
Distribution yield is as a measure of the income you receive relative to the size of your investment. For example, an ABC-REIT trading at a price of $1.00 per unit which distributed $0.05 in distributions to unit holders in a year would have a distribution yield of 5%.
This distribution yield is a very important number because you can estimate the amount of passive income you are might receive in a year. For example, the current unit price of Lippo Malls Indonesia Retail Trust is $0.275 and the current distribution yield is 10.58%. If you invested $100,000 in Lippo Malls Indonesia Retail Trust, your annual passive income would therefore be $10,580. As long as the fundamentals of a REIT is sound and the REIT generates good rental income, the distribution pay-out should increase year over year.
Gearing Ratio
The gearing ratio for real estate investment trusts is calculated by taking the gross borrowings divided by the total assets, based on the latest valuation of the REIT. The debt limit for Singapore REITs is 45%, which represent the maximum level the REIT manager can borrow to grow the DPU without issuing any new shares. It is not always good for the REIT manager to issue new shares because it causes dilution to the existing shareholders which may cause the share price to drop or DPU to drop. In addition, the existing shareholders need to inject more capital to subscribe to the new shares.
For example, currently Ascendas Hospitality Trust’s gearing ratio is 23.7%. This REIT has huge debt room before getting close to the 45% limit. Ascendas Hospitality Trust can borrow to acquire new hotels to grow the DPU without issuing any new shares.
However, looking at OUE Commercial Trust, the gearing ratio is 40.3% and so has limited debt room to borrow to grow DPU. Thus, there is a very high probability the REIT manager will raise funds through shares placement from the existing shareholders or new shareholders through private placement.
Price to NAV Ratio (also known as Price to Book Ratio)
The P/NAV ratio shows a REIT’s share price to the net asset (or book) value per share. It shows how much investors are prepared to pay per $1 of net assets. In short:
- Price/NAV = 1: Fair Value
- Price/NAV < 1: Under Value
- Price/NAV > 1: Over Value
For example: Price/NAV of the Keppel DC REIT is 1.34. This means that Keppel DC REIT’s share price is trading at 34% premium to its Net Asset Value. In other word, this REIT is over priced in term of the valuation.
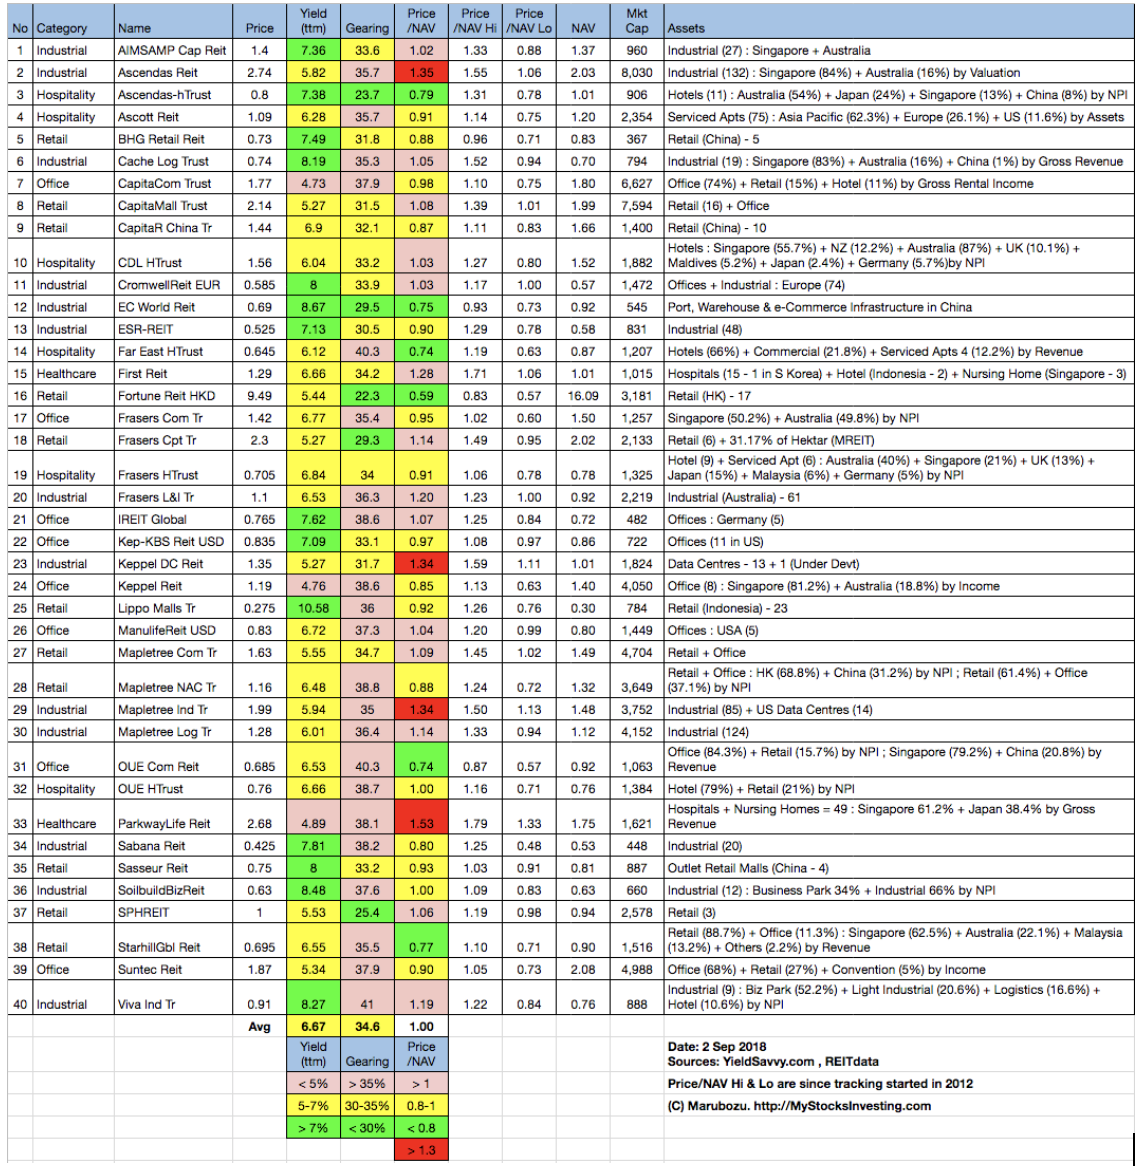
Table 1 below shows the compilation of 40 REITs in Singapore as of Sept 2018 with colour coding of the Distribution Yield, Gearing Ratio and Price to NAV Ratio. This gives investors a quick indication of which REITs are attractive enough to consider for in-depth analysis.

Table 1: Singapore REIT Fundamental Comparison Table Sept-2018
Summary of Singapore REITs Table (Sept-2018) compared to Aug 2018 Singapore REITs Table
- Price/NAV stays at 1.00 (Singapore Overall REIT sector is at fair value now).
- Distribution Yield increases from 6.66% to 6.67% (take note that this is lagging number). About one third of Singapore REITs (14 out of 40) have Distribution Yield > 7%.
- Gearing Ratio increases from 34.5% to 34.6%. 22 out of 40 have a Gearing Ratio of more than 35%. In general, the Singapore REITs sector gearing ratio is healthy.
- The most overvalued REIT is Parkway Life (Price/NAV = 1.53), followed by Keppel DC REIT (Price/NAV = 1.34), Ascendas REIT (Price/NAV = 1.35) and Mapletree Industrial Trust (Price/NAV = 1.34).
- The most undervalued REIT (based on NAV) is the Fortune REIT (Price/NAV = 0.59), followed by Starhill Global REIT (Price/NAV = 0.77), Far East Hospitality Trust (Price/NAV = 0.74), OUE Comm REIT (Price/NAV = 0.74) and EC World REIT (Price/NAV = 0.75).
- The highest Distribution Yield REIT (TTM) is the Lippo Mall Indonesia Retail Trust (10.58%), followed by SoilBuild BizREIT (8.42%), Viva Industrial Trust (8.35%), Cromwell European REIT (8.49%), EC World REIT (8.44%), Sasseur REIT (8.22%) and Cache Logistic Trust (8.09%).
- The highest Gearing Ratio REITs are Viva Industrial Trust (41%), Far East HTrust (40.3$) and OUE Comm REIT (40.3%).
Summary
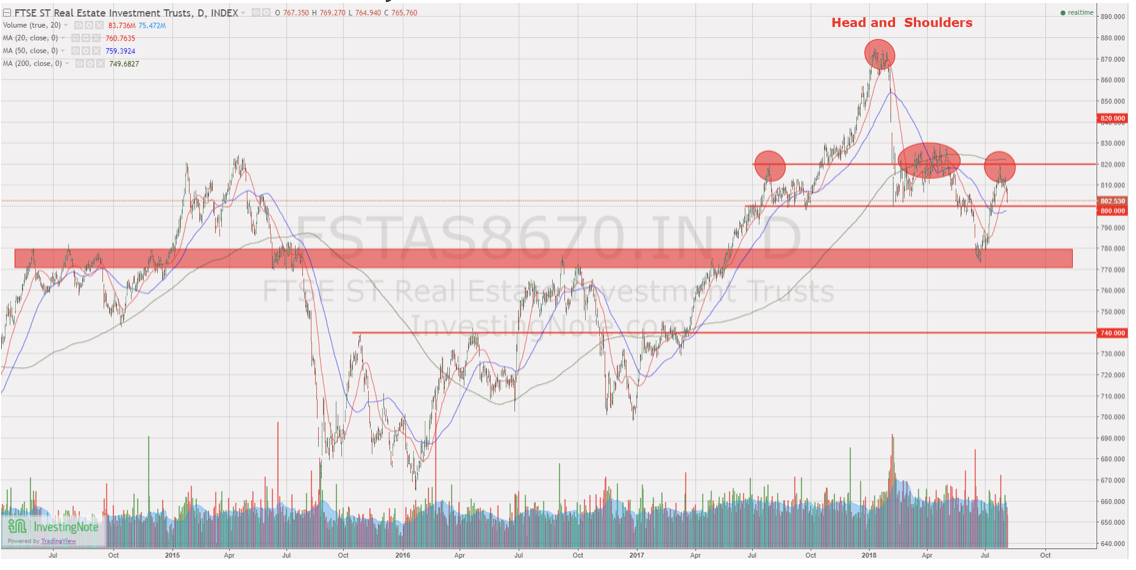
Fundamentally the whole Singapore REIT sector is at fair value now. Overall yields for Singapore REITs are still attractive (with an average yield of 6.67%). Yield spread (reference to 10-year Singapore government bond) is 4.29% (compared to previous month of 4.183%). DPU yield for a number of small and mid-cap REITs are quite attractive (>7%) at the moment. However, technically, the FTSE ST REIT index is forming a Head and Shoulder trend reversal chart pattern, and currently trading sideway waiting for the breakout. More down side is expected if the 800 support level is broken. It is time to get our watch list ready if the REIT sectors continue to correct to an attractive entry level.

Chart 2: FTSE ST REIT Index


