About a dozen times a year, Halkin Services holds a speaker event in London. The interests of our group of mainly financial professions are vast and wide, spanning macroeconomics and credit, global investment strategy and risk, intelligent technical analysis, gold and alternative investments, innovations in technology from biotech to electric vehicles. At a recent Halkin dinner, we invited Robin Griffiths, also a Halkin director, to reflect on his personal journey as an investment strategist and to articulate his key insights of multi-asset investing, shaped by over more than 50 years of experience.
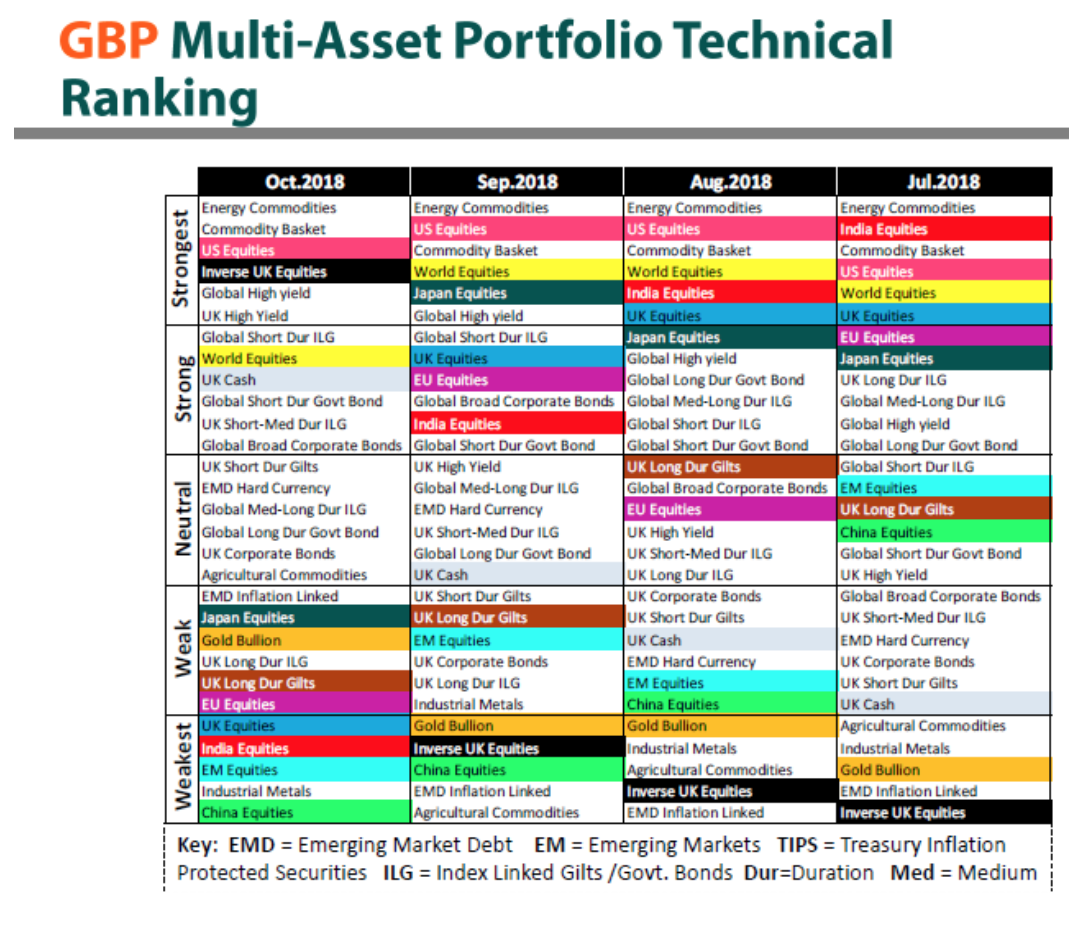
He began with the observation that neither numbers, nor charts are sufficient in themselves: there must be a story! What he didn’t say, but inferred, is that growth is a better story than value. Specifically, he explained the ECU asset technical ranking model, whose recent outputs are shown in figure 1. His main rule for fundamental analysis is that investors should focus on stocks that are part of an index. If it is not in the index, for all practical purposes, it does not exist. Robin uses the 200-day moving average and the position of the current price in relation to it, as his starting point. Robin allocates equities to five categories (Strongest, Strong, Neutral, Weak, and Weakest). Investors should focus on the top 10 stocks. The central idea is to hold the assets for at least three months and not to worry about daily changes in prices during this period.

Figure 1
In figure 1, as at October 2018, only US equities were above the world equities index. By contrast, India and China equities underperformed the world equities index. The deceleration in China has been driven by trade tensions with the US. In India, inflation has increased substantially as a result of higher oil prices. However, the MSCI India index has recovered since the summer to a 2 per cent shortfall year to date, slightly better than the 3.6 per cent fall in the MSCI world index. A key message from the presentation is that, most of the time, growth outperforms value. Even after the recent setbacks, the S&P 500 growth ETF has increased by 8.7 per cent, year on year. In the same period, the S&P 500 value ETF has increased by 2.2 per cent.
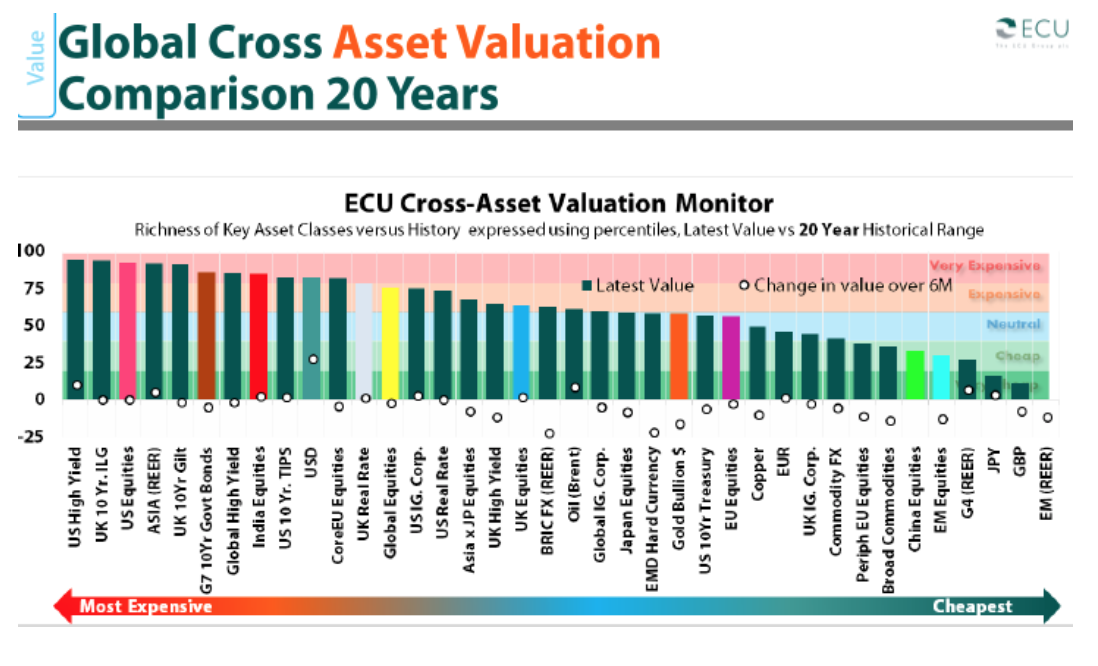
However, for those who believe that value is finally coming into favour, figure 2 shows ECU’s cross-asset valuation monitor, ranking assets from the most expensive (US high yield bonds and UK index-linked) to the cheapest assets (Pound Sterling, Japanese Yen and a basket of emerging market currencies).

Figure 2
In general, “buy the dip” does not work. It is not a recommended investment strategy now that the US central bank is unwinding its balance sheet. In the era of low interest rates, central banks have inflated stock prices. With Quantitative Tightening, there will be less support for the stock market because the number of buyers of corporate bonds will be reduced. Also, companies that have relied on debt issuance for share repurchases to support stock prices may face challenges as borrowing costs increase. Robin highlighted the importance of the 200 day Moving Average (MA) as a crucial indicator for long term fundamentals. In July, 72 per cent of global stock markets were above their respective 200 day MA, signalling a bullish trend. However, by October this had fallen to 22 per cent, qualifying categorically as a bear market.
A positive aspect from the ECU asset technical ranking model is that it does not assume a random walk process. Prices don’t reflect all available information and are not determined by a series of random movements. Models such as the Capital Asset Pricing Model (CAPM) that are based on this hypothesis are not a good framework to analyse the stock market. To access Robin’s research at ECU, visit here.


