FTSE ST Real Estate Investment Trusts (FTSE ST REIT Index) has increased from 767.98 to 783.05 (+1.96%) compared to my last post on Singapore REIT Fundamental Comparison Table on 5 November 2018.
Currently the index is trading in a downward trend channel after finding a short term support at around 760. This support has been tested on four occasions since mid October. Currently, the REIT index moves above the 20D and 50D SMA indicating short term bullishness. There may be a chance the REIT index enters into a sideways consolidation mode based on the chart pattern.
Based on the current chart pattern and trend analysis, the trend for the Singapore REIT direction is SIDEWAYS to DOWN! The REIT index will be capped by the immediate resistance at about 800 which is the 200D SMA resistance and also the round number.
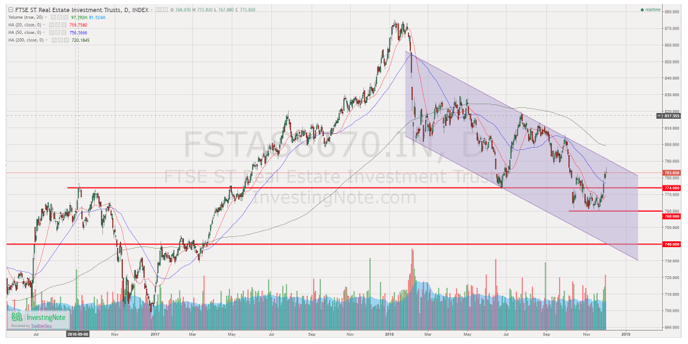
Chart 1: FTSE ST REIT Index (FSTAS8670)
Fundamental Analysis of 39 Singapore REITs
Table 2 is a compilation of 39 REITs in Singapore as of November 2018, with colour coding of the Distribution Yield, Gearing Ratio and Price to NAV Ratio. This gives investors a quick glance as to which REITs are attractive enough to have an in-depth analysis.
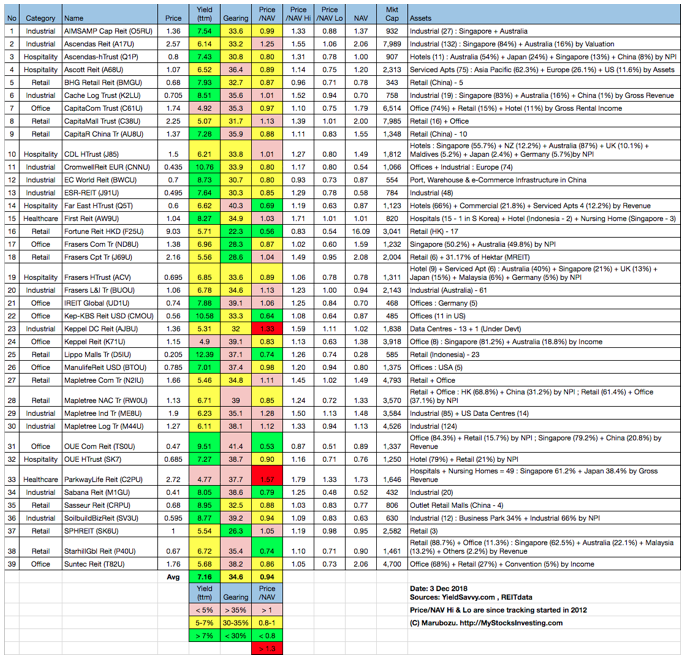
Table 2: Singapore REIT Fundamental Comparison Table December 2018
Summary of Singapore REITs Table (December 2018) compared to November 2018 Singapore REITs Table:
- Price/NAV increased from 0.93 to 0.94 (Singapore overall REITs sector is now under value).
- Distribution yield stayed at 7.16% (take note that this is lagging number). About 46% of Singapore REITs (18 out of 39) have a distribution yield >7%.
- Gearing ratio increased slightly from 34.5% to 34.6%. 19 out of 39 have a gearing ratio of more than 35%. In general, the Singapore REITs sector gearing ratio is healthy. Note: The limit of the gearing ratio for REITs listed in Singapore Stock Exchange is 45%.
- The most overvalued REIT is Parkway Life (Price/NAV = 1.57), followed by Keppel DC REIT (Price/NAV = 1.33), Mapletree Industrial Trust (Price/NAV = 1.28) and Ascendas REIT (Price/NAV = 1.25).
- The most undervalued (base on NAV) is OUE Comm REIT (Price/NAV = 0.53), followed by Fortune REIT (Price/NAV = 0.56), Keppel KBS US REIT (Price/NAV=0.64), Far East Hospitality Trust (Price/NAV = 0.69) and Starhill Global REIT (Price/NAV = 0.74).
- The highest distribution yield (TTM) is Lippo Mall Indonesia Retail Trust (12.39%), followed by Cromwell European REIT (10.76%), Keppel KBS US REIT (10.58%), OUE Comm REIT (9.51%), Sasseur REIT (9.02%), SoilBuild BizREIT (8.99%), EC World REIT (8.73%) and Cache Logistic Trust (8.51%).
- The highest gearing ratios are Far East HTrust (40.3%) and OUE Comm REIT (41.4%).
Charts 3 & 4 are the Singapore REITs bubble charts used visually for different screening purposes. The size of the bubbles represents the market capitalisation of a REIT. In one glance, we can immediately compare the size of the market value between REITs.
Chart 3 compares different Singapore REITs with distribution yields relative to the Price/NAV valuation. We can find REITs with an attractive valuation from the Top Left Quadrant (i.e. under value and a high distribution yield).
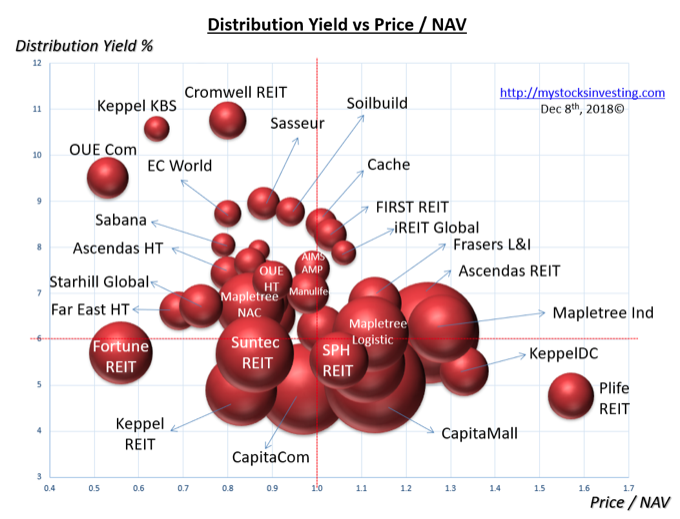
Chart 3: Singapore REIT Bubble Chart: Value Pick
Chart 4 compares different Singapore REITs with a gearing ratio relative to the Price/NAV valuation. We can find REITs with risks of value destruction due to potential rights issues from the Top Right Quadrant (i.e. over value and a high gearing ratio).
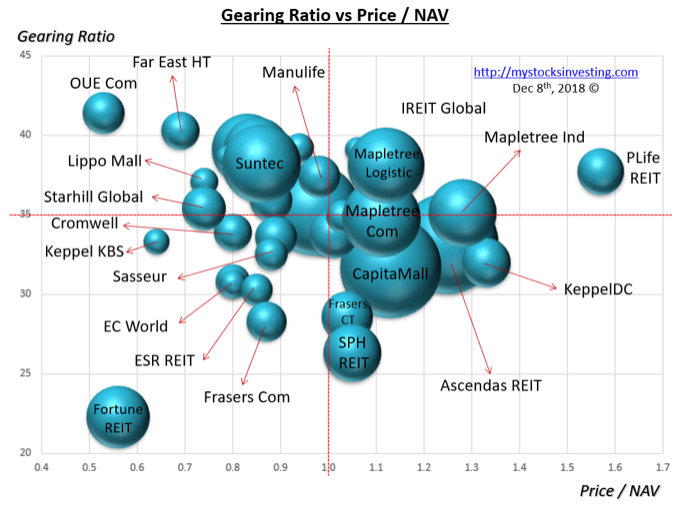
Chart 4 Singapore REIT Bubble Chart: Risk Avoidance
Sector Comparisons for Singapore REITs
In general, there are 5 sectors for Singapore REITs:
- Retail Malls
- Commercial Offices
- Industrial (Factories and Warehouses)
- Hospitality (Hotel and Service Residences)
- Healthcare (Hospital and Home Care)
Chart 5 shows the Price/NAV comparison for all 5 REIT sectors. This chart will give an overview on the current REIT valuation compared to its historical value (the high-low range of Price/NAV) since I started tracking them in 2012.
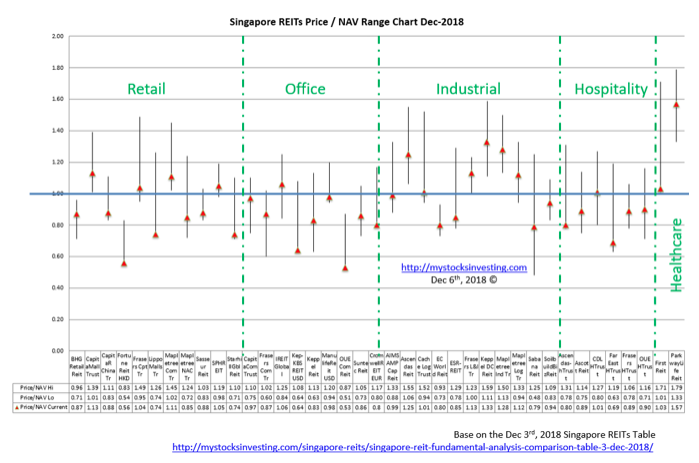
Chart 5: Singapore REIT Sector Comparison Based on Price/NAV
The red triangle indicates the current Price/NAV (November REIT table) and the shadow represents the historical high and low of Price/NAV. As seen from Chart 3, the Retail, Office and Hospitality sectors are generally under value (Price/NAV <1) and the Healthcare sector is over value.
Fortune REIT, Lippo Mall Indonesia Retail Trust, Sasseur REIT, Keppel-KBS US REIT, EC World REI and Ascendas Hospitality Trust are all currently trading near to the lowest historical Price/NAV since 2012. Using this Price/NAV range chart helps investors to identify the potential entry level for their Singapore REIT portfolio.
Summary
Fundamentally, the whole Singapore REITs is currently under value. The overall yield for Singapore REITs is getting attractive (average yield of 7.16%). The last time we have seen a Price/NAV = 0.93 and a Distribution Yield of more than 7% is back in December 2015. You may compare the Singapore REIT Fundamental Comparison Table in December 2015 to see the similarity and you should be able to identify some attractive opportunities.
Yield spread (reference to the 10-year Singapore government bond) has compressed from 4.654% to 4.476%. DPU yield for a number of small and mid-cap REITs is very attractive (>8%) at the moment. Some big cap REITs are also getting attractive in terms of valuation and distribution yield. There were number of rights issues recently like Keppel KBS US REIT and Cromwell European REIT. It is expected the frequency of rights issue by the REITs will increase in a rising interest rate environment because the cost of borrowing is relatively cheaper compared to debt financing. Investors have to pay extra attention and reserve additional cash for any rights issue.
Technically, the REIT index is entering into a consolidation phase with immediate support at 760. The current price level for the REIT index may have already been priced in the interest rate hike to 2.5%. As long as 760 support holds, it may be a good time for more accumulation because currently the risk premium is very attractive for small and medium cap REITs. Investors can do some selective shopping when the down trend stops for those REITs.
Safe shopping on Singapore REITs!


