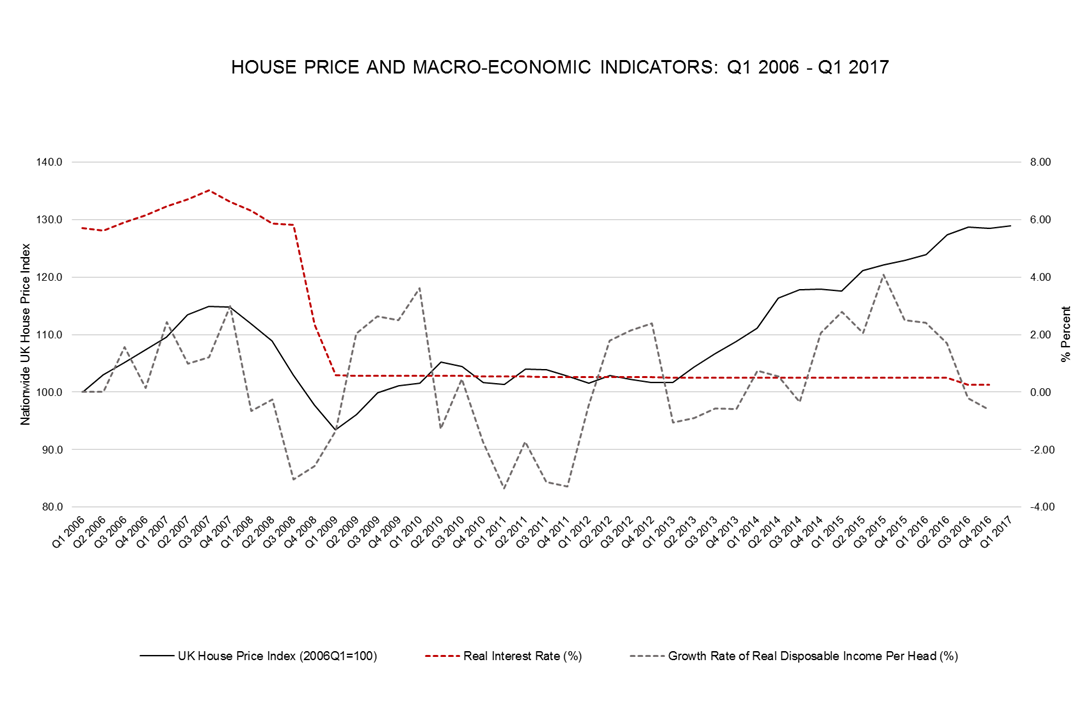
The chart suggests that the housing market boom since 2013 has not been the result of the low interest rates; instead, real income growth might be a key driver.
Our analysis leads us to conclude that real interest rates don’t seem to influence house prices in an effective manner. Looking at the chart, between 2006 and 2008 house prices kept growing, despite increasing real interest rates. After the financial crisis in 2008 when real interest rates declined sharply, and remained at very low levels (less than 0.3), house prices just bounced up slightly and remained stable until 2013.
The growth rate of real disposable income per head, however, has a similar shape as the house price index, and in our view is a leading indicator for house price trends.
The three phases of house price increases (2006-2008, 2009-2010, and 2013 onwards) are all followed (between two to four quarters later) by periods of real income growth. Interestingly, income levels have started to drop since Q3 2015, which might be related to the softening of house price increases in Q1 2017.


