Summary
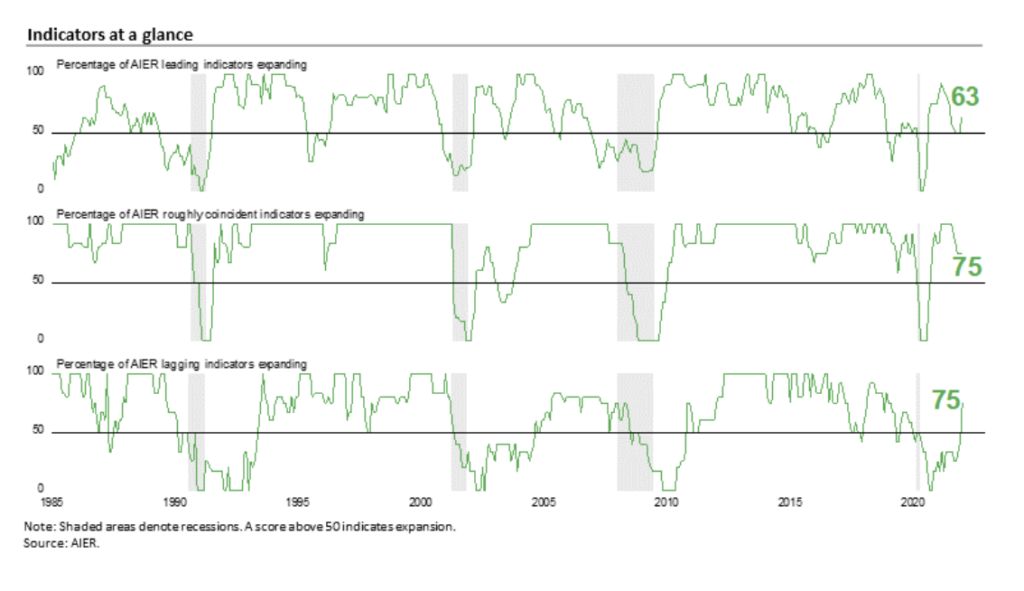
AIER’s Leading Indicators Index posted a solid gain in January, rising to 63 following three consecutive months at the neutral 50 mark. The gain was the largest one-month increase since September 2020, leaving the index at its highest level since July 2021. The Roughly Coincident Indicators Index was unchanged again in January, holding at 75 for a third consecutive month, while the Lagging Indicators Index posted a 33-point gain, the largest since November 2010, and is at its highest level since February 2019 (see chart). January was the first month since December 2019 that all three AIER business cycle indicators were above the neutral 50 threshold.
The positive result for the AIER Leading Indicators Index suggests continued economic expansion with the potential for a broadening of growth in the economy. However, risks remain elevated as upward price pressures continue due to ongoing production bottlenecks, labour and materials shortages and logistical problems. In addition, Fed policymakers are likely to embark on a tightening cycle beginning in March, raising the risk of a policy mistake. Furthermore, 2022 is a Congressional election year and may lead to unexpected events, given the intensely bitter partisan atmosphere and a deeply divided populace.
AIER Leading Indicators Index Rises to 63 in January
The AIER Leading Indicators index posted its largest monthly gain since September 2020, rising 13 points in January to 63. The January result is the highest level since July 2021 and follows three consecutive months at the neutral 50 level.
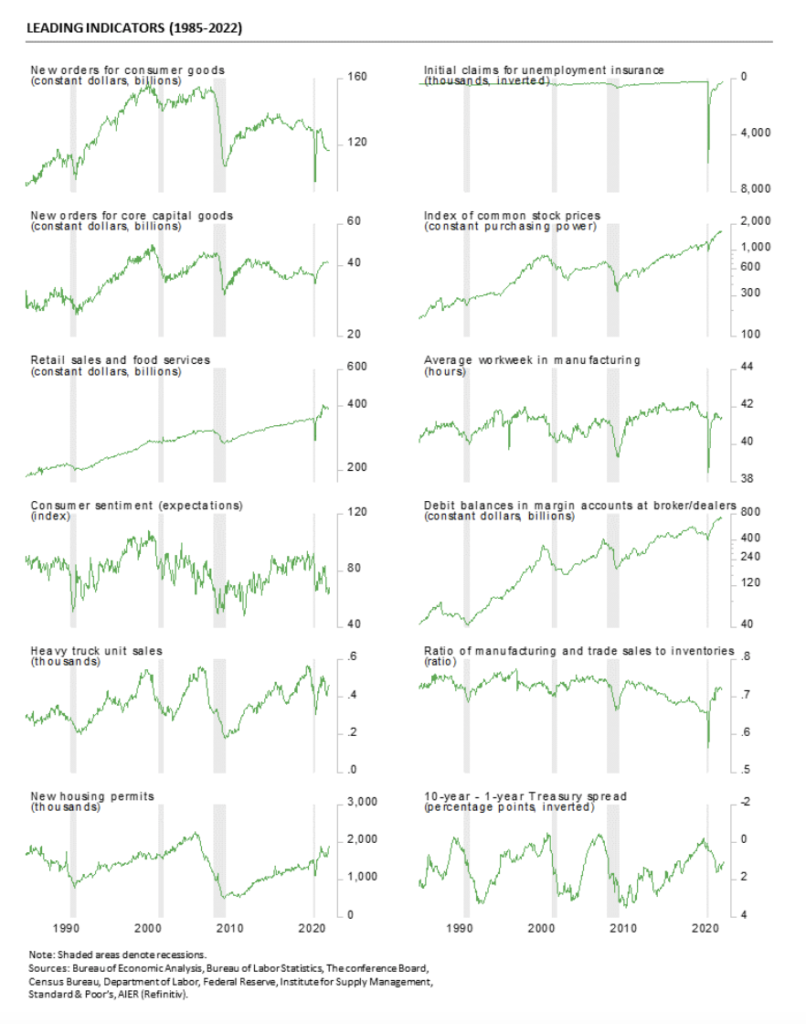
Four leading indicators changed signal in January: the real retail sales indicator weakened from a neutral trend to a negative trend, but was more than offset by improvements in the treasury yield spread indicator (neutral to positive), the housing permits indicator (negative to positive) and the heavy truck unit sales indicator (negative to neutral). In total among the 12 leading indicators, seven were in a positive trend in January while four were trending lower and one was trending flat or neutral. Initial claims for unemployment benefits, manufacturing and trade sales to inventory ratio, real new orders for core capital goods, real stock prices and debit balances in margin accounts were the five indicators maintaining favourable trends, while the average workweek in manufacturing, the University of Michigan Index of Consumer Expectations, and real new orders for consumer goods indicators all remained in unfavourable trends.
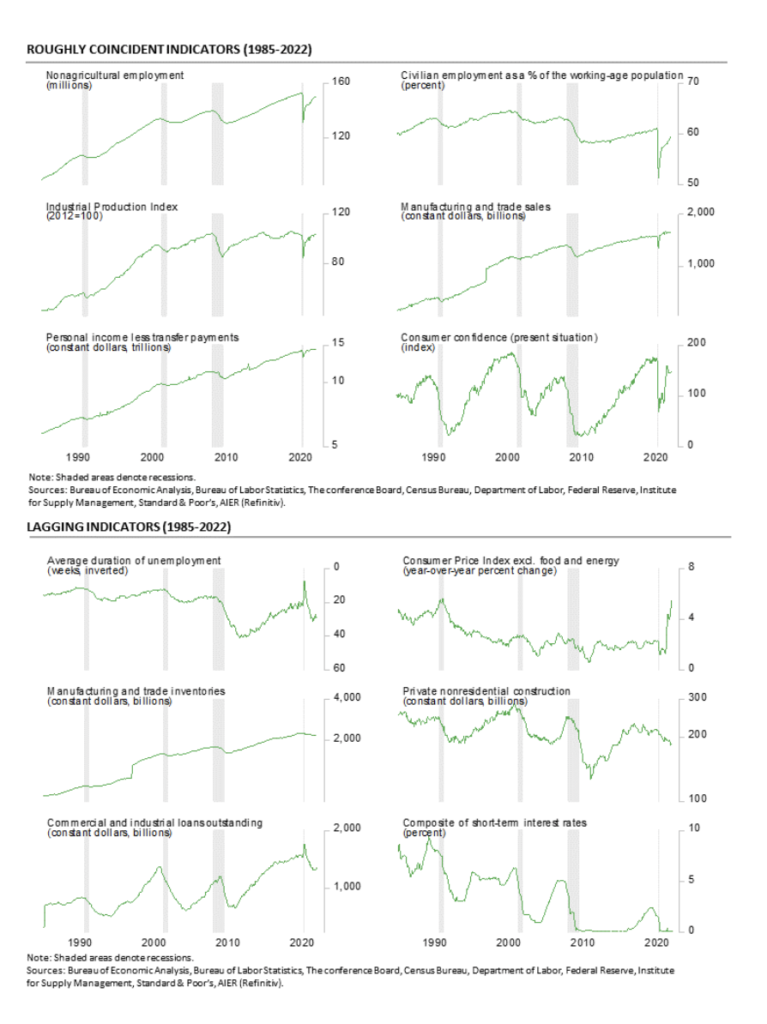
The Roughly Coincident Indicators index was unchanged in January, holding at 75 for a third consecutive month. Overall, four indicators were trending higher: nonfarm payrolls, employment-to-population ratio, industrial production, and real personal income excluding transfers. One roughly coincident indicator, consumer confidence in the present situation, was trending lower, while the real manufacturing and trade sales indicator remained in a neutral trend.
AIER’s Lagging Indicators index increased to 75 in January, up from 42 in December, 33 in November, and 25 in October. January was the first month above neutral since December 2019, ending a run of 24 consecutive months at or below neutral. Three lagging indicators showed improvement in January, with commercial and industrial loans outstanding and real manufacturing and trade inventories improving to a positive trend while the composite short-term interest rates indicator improved from an unfavorable trend to a neutral trend. Overall, four indicators were in favorable trends, one indicator had an unfavorable trend, and one had a neutral trend.
“Businesses remain focused on improving supply chains and expanding production and are likely to make progress once the wave of new Covid cases crests”
Overall, ongoing disruptions to labour supply and production, rising costs and shortages of materials, and logistics and transportation bottlenecks continue to exert upward pressure on prices. Furthermore, continued waves of new Covid cases likely exacerbated these problems in late December and January. Businesses remain focused on improving supply chains and expanding production and are likely to make progress once the wave of new Covid cases crests.
Some recent data reports suggest there may be some progress being made already on the production side while somewhat slower consumer spending could help bring supply and demand back to balance more quickly and help reduce price pressures. The weaker trend for real retail sales (AIER Leading Indicator), positive trend for industrial production (AIER Roughly Coincident Indicator), neutral trend for real manufacturing and trade sales (AIER Roughly Coincident Indicator), and positive trend for real manufacturing and trade inventories (AIER Lagging Indicator) provide some basis for optimism. Even with some easing, a shortage of labor may persist for some time.
Inventory accumulation boosts real GDP growth in the fourth quarter
Real gross domestic product increased at a 6.9% annualised rate in the fourth quarter, up from a 2.3% pace in the third quarter. Over the past four quarters, real gross domestic product is up 5.5%, putting the level slightly above trend.
Real final sales to private domestic purchasers, a key measure of private domestic demand, rose at a more modest 2.8% annualised rate in the fourth quarter following a 1.4% pace in the third quarter. Over the last four quarters, real final sales to private domestic purchasers are up 6.4%, keeping the level slightly above trend. The trend growth in real final sales to private domestic purchasers is 2.6% since mid-2009.
Among the components, real consumer spending overall rose at a 3.3% annualised rate, beating the 2.0% rate in the third quarter, and contributing a total of 2.25 percentage points to real GDP growth. Consumer services led the growth in overall consumer spending, posting a 4.7% annualised rate, adding 2.12 percentage points to total growth while durable-goods spending rose at a 1.6% pace, contributing 0.14 percentage points. However, nondurable-goods spending fell at a -0.1% pace, subtracting 0.02 percentage points. Within consumer services, spending was particularly strong on transportation services and recreation services.
Business fixed investment increased at a 2.0% annualised rate in the fourth quarter of 2021, contributing 0.28 percentage points to final growth. That gain was led by a 10.6% jump in intellectual-property investment (adding 0.53 points to growth) and a 0.8% gain in spending on equipment (adding 0.05 percentage points). Those gains were partially offset by a decline in spending on business structures where spending fell at an 11.4% rate, the third decline in a row and subtracting 0.30 percentage points from final growth.
Residential investment, or housing, fell at a 0.8% annual rate in the fourth quarter compared to a 7.7 annualised drop in the prior quarter. The fourth quarter was the third decline in a row. The drop in the fourth quarter reduced overall growth by 0.03 percentage points.
Businesses added to inventory at a $173.5bn annual rate (in real terms) in the fourth quarter versus liquidation at a $66.8bn rate in the fourth quarter, adding a whopping 4.9 percentage points to fourth-quarter growth. The inventory accumulation helped boost the real nonfarm inventory to real final sales of goods and structures ratio to 3.87 from 3.80 in the third quarter and 3.75 in the second quarter. This is still below the 4.3 average for the 10 years through 2019.
Exports rose at a 24.5% pace while imports rose at a 17.7% rate. Since imports count as a negative in the calculation of gross domestic product, a gain in imports is a negative for GDP growth, subtracting 2.43 percentage points. The rise in exports added 2.43 percentage points. Net trade, as used in the calculation of gross domestic product, had a negligible impact on overall growth.
Government spending fell at a 2.9% annualised rate in the fourth quarter compared to a 0.9% pace of growth in the third quarter, subtracting 0.51 percentage points from growth.
Consumer price measures also showed a rise in the fourth quarter. The personal-consumption price index rose at a 6.5% annualised rate, up from a 5.3% pace in the third quarter. From a year ago, the index is up 5.5%. Excluding the volatile food and energy categories, the core PCE (personal consumption expenditures) index rose at a 4.9% pace versus a 4.6% increase in the third quarter. From a year ago, the core PCE index is up 4.6%.
Retail spending fell sharply in December
Retail sales and food-services spending sank 1.9% in December following a 0.2% gain in November and a strong 1.8% jump in October. Despite the December drop, total retail sales are still up 16.9% from a year ago and remain about 8% above the pre-pandemic trend.
Core retail sales, which exclude motor vehicle dealers and gasoline retailers, dropped 2.5% for the month, following a 0.1% fall in November but a 1.6% increase in October, leaving that measure with a 16.5% gain from a year ago. Core retail sales are 6.5% above the pre-pandemic trend. Slower sales may help the demand/supply imbalance that has been putting upward pressure on prices.
With retail sales continuing to run above the recent eight-year trend, measured as a share of disposable income excluding transfers, retail sales are also well above the pre-pandemic range of 3.8% to 4.1% and even above the 4.2% to 4.4% range that persisted for much of the 1992 though 2007 period. There is a reasonable expectation that retail sales as a share of income is unlikely to go significantly higher and may even decline to the more recent pre-pandemic share. If so, retail sales should slow noticeably and may help ease some of the post-pandemic demand-supply imbalance.
Among the categories, most were down in December. Just three categories posted gains while 10 showed declines. The gains were led by a 1.8% increase for miscellaneous retailers, followed by building material and garden equipment and supplies dealers with a 0.9% gain, and health and personal care stores with a 0.5% rise.
Nonstore retailers led the decliners, down 8.7%, followed by furniture and home furnishings store sales, off 5.5%, sporting goods, hobby, and bookstore sales, down 4.3%, clothing and accessory store sales, down 3.1%, and electronics and appliance store sales, off 2.9%.
Housing permits were hot in December but rising mortgage rates may cool them off
Total housing starts rose to a 1.702m annual rate in December from a 1.678mn pace in November, a 1.45% increase. From a year ago, total starts are up 2.5%. Total housing permits were very strong in December, posting a 9.1% gain to 1.873m in December from 1.717m in November. Total permits are up 6.5% from the December 2020 level.
Starts in the dominant single-family segment posted a rate of 1.172m in December versus 1.199m in November, a drop of 2.3% and are down 10.9% from a year ago. Single-family permits experienced a 2.0% rise to 1.128m versus 1.106m in November. Single-family starts are about the same level as they were in October 2020, while single-family permits are about even with their September 2020 level.
Starts of multifamily structures with five or more units increased 13.7% to 524,000 and are up a robust 56.0% over the past year, while starts for the two- to four-family-unit segment were down 66.7% at a 6,000-unit pace versus 18,000 in November. Combined, multifamily starts were up 10.6% to 530,000 in December and show a gain of 53.2% from a year ago.
Multifamily permits for the 5-or-more group rose 19.9% to 675,000, while permits for the two-to-four-unit category jumped 45.8% to 70,000. Combined, multifamily permits were 745,000, up 21.9% for the month and 41.9% from a year ago.
Regionally, single-family permits were up in three regions: the West saw a 7.0% drop to 238,000, while the South managed a modest 0.5%increase to 650,000, the Midwest gained 12.1% to 158,000, and the Northeast gained 32.3% to 82,000 in December.
Multifamily permits had two regions with gains in December. The Northeast surged 172.8% to 221,000 and the Midwest jumped 39.7% to 109,000. On the downside, the South fell 3.9% to 249,000 and the West dropped 14.0% to 166,000. The surge in the Northeast was largely driven by a jump in permits in the Philadelphia area as tax law changes were enacted affecting real estate permits issued after 31 December 2021.
Lumber prices are once again soaring, coming in around $1,279 per 1,000 board feet in mid-January. The increase in lumber costs will pressure profits at builders and may lead to more price increases for new homes. Furthermore, mortgage rates have jumped recently, with the rate on a 30-year fixed rate mortgage hitting 3.45% in mid-January. Higher home prices and higher mortgage rates are likely to slow future housing activity.
Meanwhile, the National Association of Home Builders’ Housing Market Index, a measure of homebuilder sentiment, fell back slightly in January, coming in at 83 from 84 in December, but remains at a generally favourable level. Overall sentiment remains relatively high, but inflation and supply chain disruptions continue to be significant problems. It should be noted, the survey was taken in early January before the recent jump in mortgage rates. The impact of higher rates, if they are sustained, are likely to be more fully reflected in the February Housing Market Index.
Two of the three components of the Housing Market Index fell in January. The expected single-family sales index fell to 83 from 85 in the prior month and the traffic of prospective buyers index was down to 69 from 71 in December but the current single-family sales index remained unchanged at 90.
New single-family home sales jump but prices sink
Sales of new single-family homes posted a gain in December, jumping 11.9% to 811,000 at a seasonally adjusted annual rate from a 725,000 pace in November. Despite the gain, sales are down 14.0% from the year-ago level. New home sales surged in the second half of 2020 but then slowed sharply in the first three quarters of 2021, hitting a low of 649,000 in October. Since October, sales have increased for two consecutive months.
Sales of new single-family homes were up in three of the four regions of the country in December. Sales in the South, the largest by volume, rose 14.9%, while sales in the West gained 0.4%, and sales in the Midwest increased 56.4%, while sales in the Northeast were off 15.6% for the month. From a year ago, sales were up 2.1% in the West but are off 34.1% in the Northeast, down 23.2% in the Midwest and off 17.5% in the South.
The median sales price of a new single-family home was $377,700, down sharply from $416,100 in November (not seasonally adjusted). The gain from a year ago is just 3.4% versus an 18.6% 12-month gain in November. On a 12-month average basis, the median single-family home price is still at a record high.
Despite the jump in sales, the total inventory of new single-family homes for sale rose 1.5% to 403,000 in December, putting the months’ supply (inventory times 12 divided by the annual selling rate) at 6.0, down 9.1% from November but 57.9% above the year-ago level. The months’ supply is at a relatively high level by historical comparison and is substantially higher than the months’ supply of existing single-family homes for sale. The relatively high months’ supply may be one reason for the plunge in median home price. The median time on the market for a new home remained very low in December, coming in at 2.8 months versus 2.9 in November.
Existing home sales fell in December and supply remains extremely tight
Sales of existing homes decreased 6.0% in December, to a 6.10m seasonally adjusted annual rate. Sales are down 8.3% from a year ago.
Sales in the market for existing single-family homes, which account for about 89% of total existing-home sales, dropped 5.9% in December, coming in at a 5.44m seasonally adjusted annual rate. From a year ago, sales are down 8.1%.
Condo and co-op sales fell 7.0% for the month, leaving sales at a 660,000 annual rate for the month versus 710,000 in November. From a year ago, condo and co-op sales were off 9.6%.
The dominant single-family segment saw sales decline in all four regions. Sales fell 6.8% in the West, 7.5% in the South, the largest region by volume, 1.6 percent in the Northeast, the smallest region by volume, and 4.2% in the Midwest. Sales are also down in all four regions measured from a year ago (-17.3% in the Northeast, -5.5% in the Midwest, -9.8% in the West, and -6.0% in the South).
Condo and coop sales were down in two regions in December, -20.0% in the West and -5.9% in the South but were unchanged in the Northeast and the Midwest. From a year ago, sales are off in three regions and unchanged in the Midwest.
Total inventory of existing homes for sale fell in December, declining 17.1% to 920,000, leaving the months’ supply (inventory times 12 divided by the annual selling rate) down 0.3 months at 1.8.
For the single-family segment, inventory was down 17.7% for the month at 790,000 and is 10.2% below the December 2020 level. The months’ supply was 1.7, down from 2.0 in the prior month.
The condo and co-op inventory fell 15.4% to 126,000, pushing the months’ supply down to 2.3 from 2.5 in November. Months’ supply is 20.7% below December 2020.
The median sale price in December of an existing home was $354,300, 14.6% above the year ago price. For single-family existing home sales in December, the price was $360,300, a 14.9% rise over the past year. The median price for a condo/co-op was $305,200, 12.0% above December 2020.
Persistent faster price gains for the single-family segment have resulted in a significant gap developing over the past decade. While median prices were about equal between 2004 and 2014, since 2014, faster price gains for the single-family segment have pushed the median price for existing single-family homes about 18% above the median condo price.


Originally published by the American Institute for Economic Research and reprinted here with permission.


