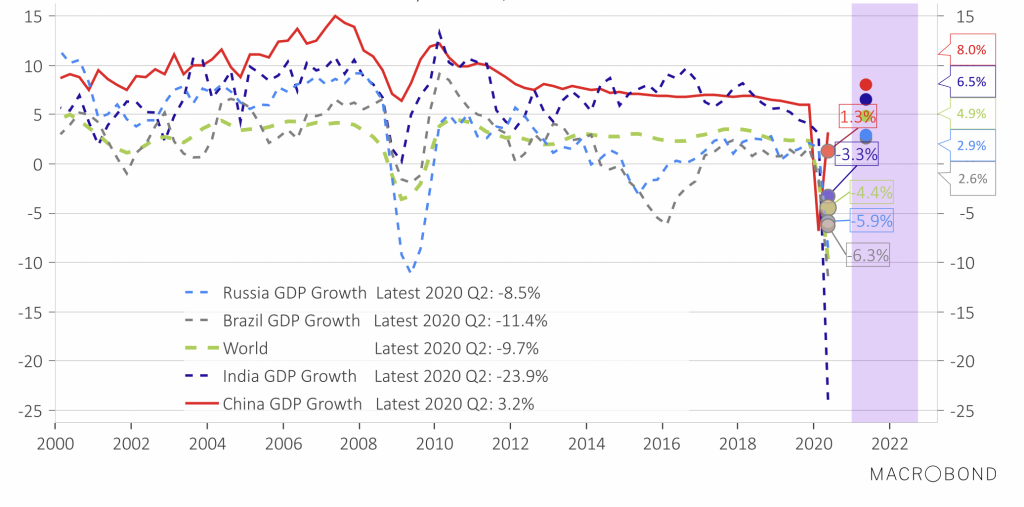
Annual GDP growth forecast by IMF WEO, World Bank and EIU
An era of globalisation that boosted economic growth in developing countries for many years is shifting to an era of deglobalisation with increased protectionism. Many success stories in the recent decades have followed upon growth in trade and exports. The big four developing economies of the 20th century are Brazil, Russia, India and China, collectively known as the BRIC economies.
In this month’s chart, I have plotted the historical GDP quarterly growth rate of BRIC countries and the world GDP along with the annual GDP forecasts by the IMF World Economic Outlook, the World Bank and the Economist Intelligence Unit. The dots in the chart represent the average of the three forecasts for the year. Economic growth of the four countries centred around an export-led growth model but with somewhat disparate characteristics. In the last two decades, China and India became major exporters of manufactured goods and services, while Brazil and Russia were driven largely by exports of raw materials. The appetite for natural resources by rapidly developing countries such as China and India were an important factor in the commodity price boom from the year 2000 up until 2014, benefiting the exporters of natural resources. As seen in the chart, the decline in raw material prices has also resulted in the weakening GDP growth from 2014 in Brazil and Russia.
The latest GDP figures show that the economic decline triggered by the global pandemic has affected all BRIC economies equally, but most substantially India with around a 23.9% drop in GDP growth. Yet the average forecast points to -3.3% of annual GDP growth for 2020, higher than for China, Brazil, Russia and world GDP. The annual GDP average forecast for 2022 has China leading with 8.0% followed by India’s 6.5%. Both Russia and Brazil are below the world GDP figure of 4.9% with 2.9% and 2.6% respectively. It is likely that the forecast might change as we are still in the midst of the ongoing coronavirus pandemic. At the same time, we have many other uncertainties around the world with increasing protectionist policies and geopolitical challenges leading to the era of continued deglobalisation.


