The news of the week is NOT the Fed cutting 50 bps – yes sure, that’s important but there is something much more relevant going on.
The Chinese economy keeps imploding from within.
And we should pay attention.

The Property Price Index for Chinese tier-1 cities keeps making new lows, and it’s now approaching levels last seen 8 years ago!
At this point you might ask yourself: well, is it so bad if house prices drop a bit?
In standard circumstances I’d tell you this is not a disaster.
But for Chinese people, things are different:

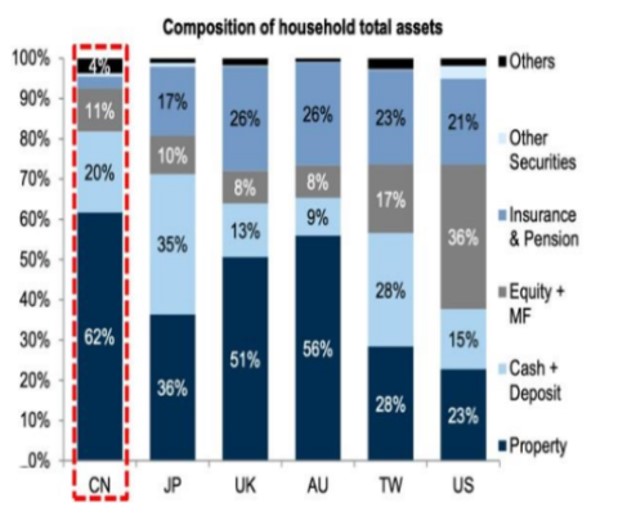
Chinese households hold 60%+ of their wealth in Chinese properties.
This is way higher than in the US, where households only hold 23% of their wealth in properties while the majority sits in the stock market or retirement plans.
Now imagine if your stock portfolio dropped back to 2016 levels.
How would you feel about it?
That’s how Chinese households are feeling!
But why is China imploding this fast?
It’s because Xi Jinping wants to engineer a new ‘‘common prosperity’’ economic model which relies less on leverage, tech bubbles, bridges in the middle of nowhere and frothy house prices and more on internal consumption.
The problem is that when you deleverage a 50 trillion (!) worth real estate market inflated with absurd levels of leverage…well, that’s not an easy task to achieve.
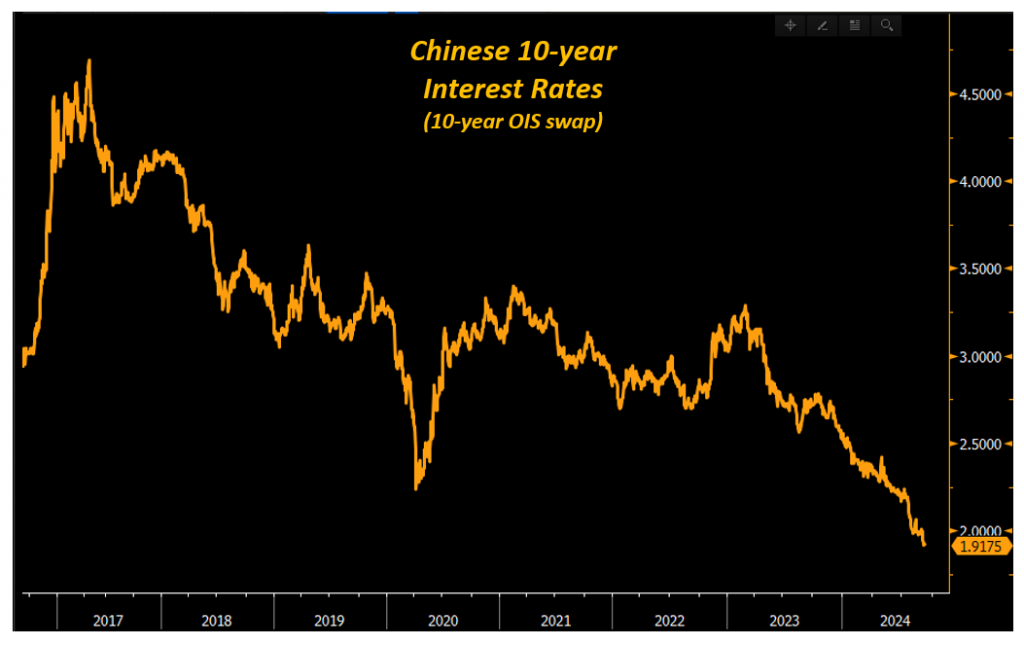
China is cutting interest rates aggressively to try and limit the slowdown: Chinese 10-year interest rates just dropped below 2% for the first time..ever?
Yet cutting interest rates while the real estate market is deleveraging won’t help much.
Ask Japanese people in the 1990s for reference:

China keeps imploding from within and this matters for the rest of the world.
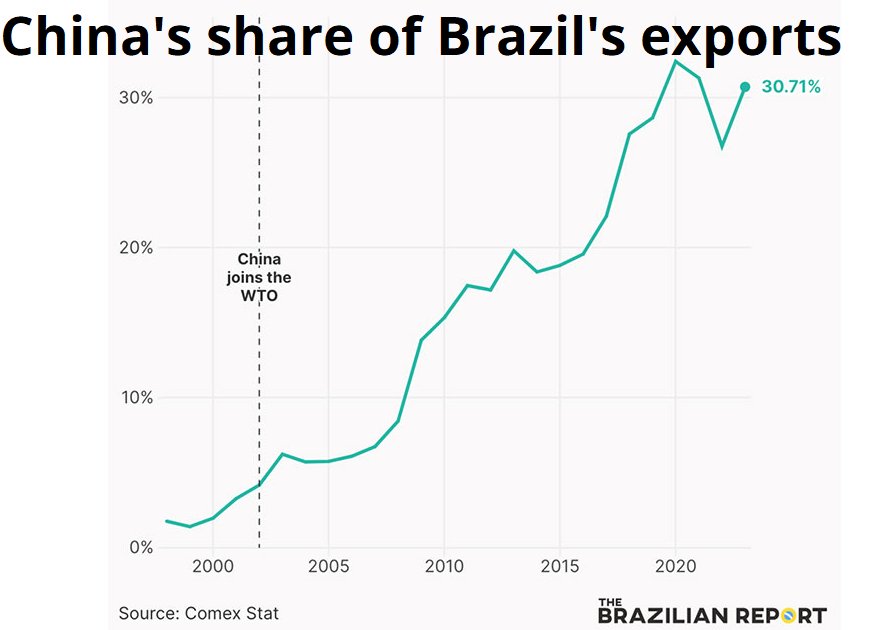
For example, China is the number 1 trade partner for many countries and for specific jurisdictions it represents a very large importer for the commodities they produce.
See Brazil for instance:

Everybody is talking about the Fed.
But the real macro mover to watch here is China.
Keep it on your radar!
And of course – who am I not to spend a few words on the Fed as well.
This week’s 50 bps cut was initially celebrated by markets: after all, if the Fed proceeds with such a sizable cut what’s not to celebrate?
The problem with such a simple narrative is that the Fed’s monetary policy needs to be measured against the underlying growth conditions.
Fed Funds at 4.75% can be:
– Still loose: if the US economy is running ultra-hot
– Still tight: if the US economy is rapidly weakening
In other words: the monetary policy looseness/tightness needs to be measured taking into consideration the ongoing economic conditions.

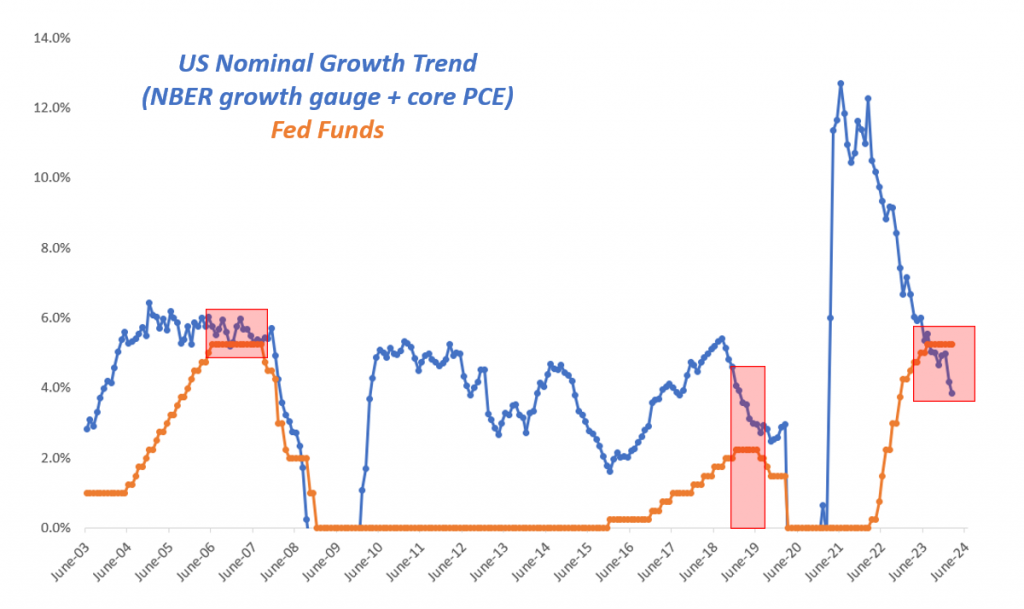
The chart above does just that, and it compares Fed Funds (orange) with the underlying trend of US nominal growth (blue).
The US nominal growth proxy is built using core PCE – the Fed’s official target for inflation – and the NBER gauge for US real economic growth.
Why the NBER gauge and not real GDP?
Because the NBER is the body that ultimately determines whether the US is in a recession, and they do so using a broad basket of 7 indicators tracking every sector of the US economy (from consumers to industrial production to the labor market).
The outcome of this analysis is straightforward.
There is nothing to celebrate.
The Fed’s policy is still dangerously tight.
As you can see, it only rarely happens that Fed Funds (orange) sit close or even above US nominal growth (blue) for a prolonged period of time.
And when that happens, it’s never good news for the economy.
The Fed needs to do more.
Or it risks falling further behind the curve.
This article was originally published in The Macro Compass is republished here with permission.


