This monthly report from Consilia Capital on fund performance looks at a number of different topics.
August performance – which strategies performed best?
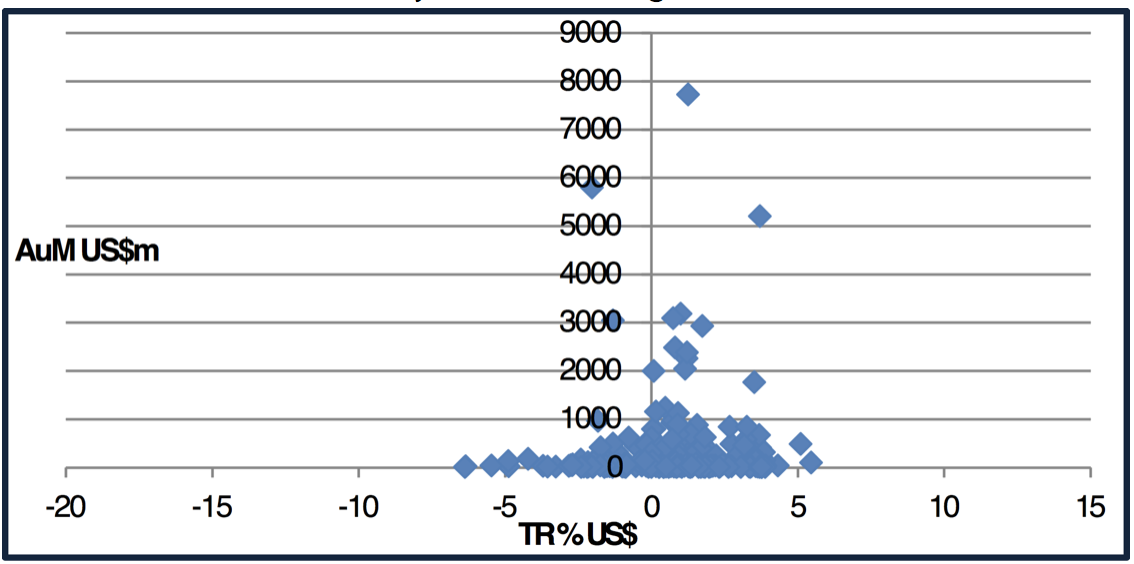
Global real estate securities funds returns August 2018

Source: Consilia Capital/Bloomberg
As can be seen from the table below, (which is ranked by average August returns for each main mandate) August saw a modest recovery (after a dreadful 1H 18) particularly for US and Income Funds, which have now joined European Funds in generating positive returns for the year to date.

Source: Consilia Capital/Bloomberg
Fund Flows- What are the trends?
After an uptick in inflows in August for Passive Funds, this reversed back to the negative trend YTD in August. Income and Real assets funds have had a third successive month of inflows.
Listed and Unlisted Real Estate Performance in European Pension Funds
Although there is no shortage of academic studies on listed real estate performance, there is a shortage of papers focussed on actual fund data, performance and allocations. This month we summarise a report on this topic produced by CEM Benchmarking, and commissioned by EPRA. The report focusses on:
- Asset allocation
Dutch funds allocate 8 percent to real estate on average, split 25/75 between listed and unlisted real estate. U.K and Other Euro area funds allocate just over 5 percent to real estate on average, nearly all of it unlisted.
Trends – Dutch funds are de-risking, reducing allocations to equities and real estate while increasing allocations to fixed income. U.K. funds are doing the opposite, increasing allocation to equity and real estate while lowering allocation to fixed income. Other Euro area funds are comparatively stable.
- Lagged reporting
Asset class returns for private equity, unlisted real estate, and unlisted infrastructure as recorded by funds are not comparable to listed asset class returns. The reason is lagged reporting. For all three asset classes, the average lag is nearly one calendar year.
Because of the dispersion in reporting lag, average annual returns from unlisted asset classes appear significantly smoothed (i.e., less volatile than they are). Smoothed returns from unlisted asset classes is purely mathematical artifact, and not something a fund can achieve.
- Returns
Listed real estate – the arithmetic average net return for Dutch funds (2005-2016) was the second highest at 9.32 percent, comparable to private equity at 10.78 percent. For other Euro area funds over the shorter sample period 2008-2016 it was considerably lower at 5.59 percent compared to 11.55 percent for private equity. For U.K. funds where only 2010-2016 data is available for all asset classes, listed real estate had the highest net return of 10.93 percent, nearly equal to public and private equity at 10.76 and 10.86 respectively.
- Risk
Sharpe ratios for all asset classes are consistent across Dutch and other Euro area funds with the exception
of hedge funds (data has not converged) and unlisted infrastructure (insufficient data). Relative order is
(from highest Sharpe ratio to lowest): 1. Fixed income, 2. private equity, 3/4. public equity/listed real estate (a statistical tie), 5. unlisted real estate, 6. “other”.
- Correlation
After standardising returns of unlisted asset classes for lagged reporting, listed and unlisted real estate are seen to be highly correlated to each other for Dutch funds (correlation of 88 percent), but less so for other Euro area funds (correlation of 58 percent), and not at all U.K. funds (correlation of negative 9 percent). The low correlation for other Euro area funds likely reflects differences in listed and unlisted real estate portfolio construction. By contrast, for U.K. funds the low correlation likely results from shared management of listed and unlisted real estate portfolios, resulting in lagged reporting of listed real estate returns as well.
- The Portfolio Volatility Suppression impact of Unlisted Real Estate
In conclusion the primary effect of unlisted real estate and other unlisted assets on total fund returns is to artificially supress volatility. By standardizing unlisted asset class returns, CEM estimate that the volatility of total fund returns is suppressed by anywhere from seven percent (other Euro Area funds) to 16 percent (Dutch funds).
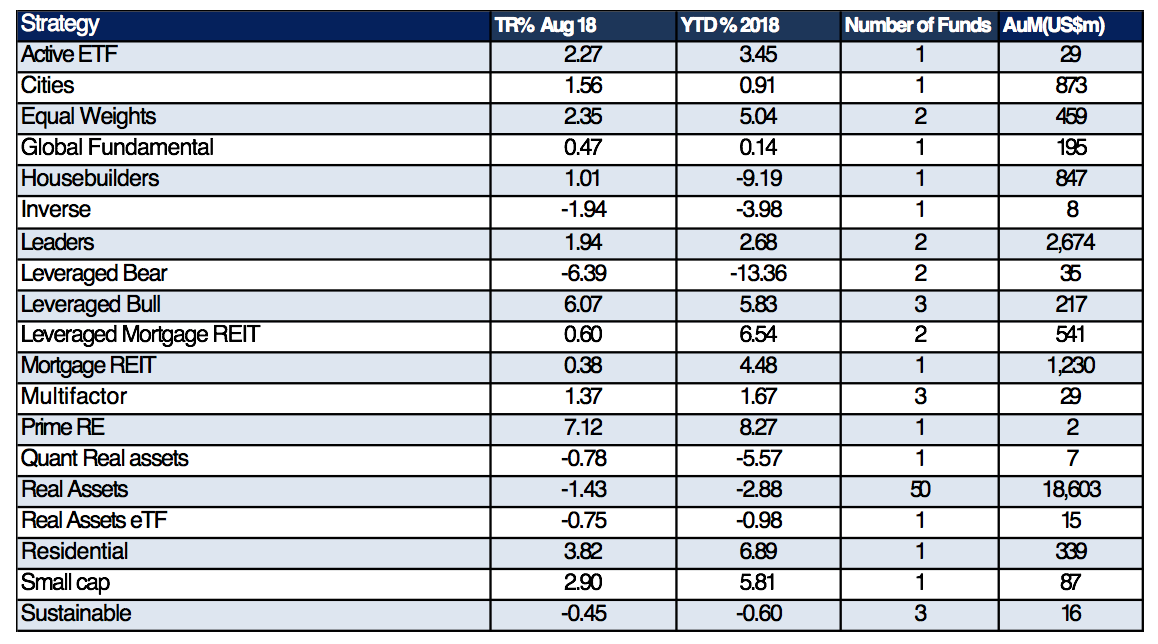
August performance Alternative strategies

Source: Consilia Capital/Bloomberg


