Last quarter’s reports showed Leeds lagging behind the upward house price curve, while Birmingham and Manchester prices steamed ahead. In this month’s Market Mover, REalyse’s CEO and Statistical Mastermind, Gavriel Merkado, takes a closer look at Leeds’ trend divergence and what it might mean for developers in the area.R
In our last Quarterly Report for UK cities we identified that property prices in Leeds had deviated from the stronger trends seen in Manchester and Birmingham.
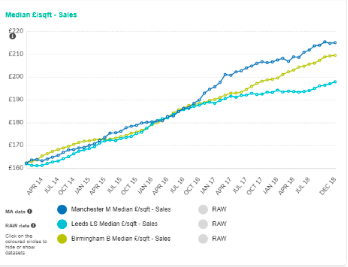
The question is, of course, why has this happened?
In answer to this, we’ll investigate three things in this month’s Market Mover:
- What has been happening with income and affordability?
- What has been happening with planning permissions in Leeds?
- What has been going on with new build properties in those markets?
Income and Affordability Theories
My first theory to float is that perhaps affordability in Leeds has hit some kind of price ceiling, whereas the other cities still have significant room for further price increases.
Using REalyse’s database, the figures show that the mortgage payments on a typical property in Manchester are equivalent to 24.9% of average individual gross earnings, and in Birmingham it’s 26.8%. Likewise, in Leeds mortgage payments account for 24.3%.
So there isn’t actually a great deal of difference between them. There goes that theory!
Planning Applications Analysis
In Leeds, a grand total of 246 significant planning applications were refused between the years 2014 and 2019.
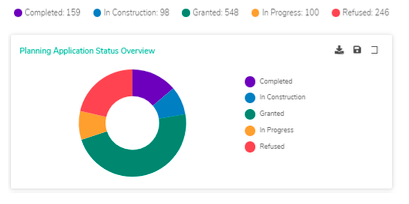
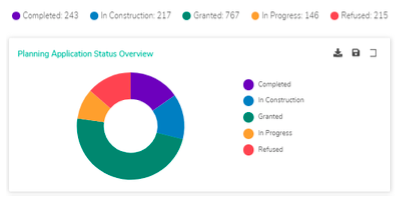
In Manchester, a lower number of applications were refused. These refusals were significantly out of a higher number of overall of applications, as the chart below depicts.
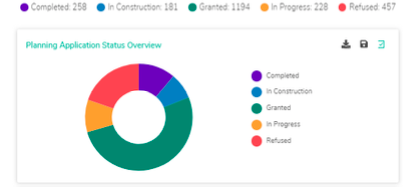
Whereas, in Birmingham, there were a similar proportion of refused applications as there were in Leeds. However, the volume of applications in Birmingham was significantly higher. For each planning application in Leeds, there were two in Birmingham.
This may be leading us towards the answer as to why there has been such divergence in overall prices between these cities.
New Build Transactions
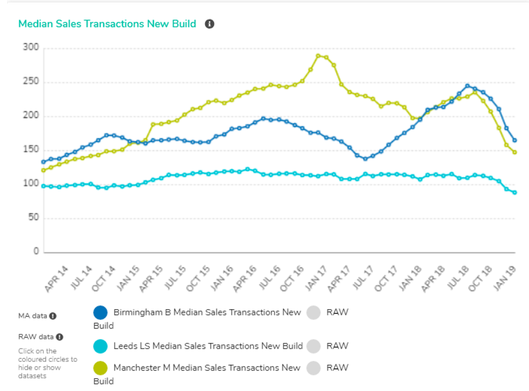
Looking in more detail at the number of new build transactions across these cities shows that volumes in Leeds have remained relatively steady, with approximately 115 sales transactions per month. Birmingham and Manchester both have significantly higher transactions in this respect, but then the cities are themselves much larger, so this is not altogether surprising.
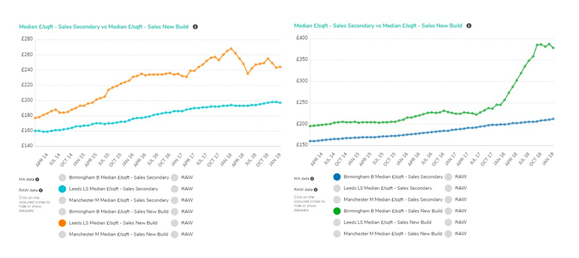
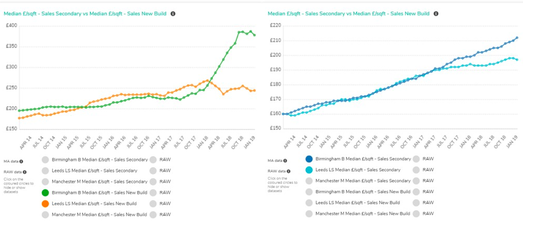
A clearer answer emerges when looking at how the pricing of new build and secondary stock properties has changed in Leeds and Birmingham. In the first chart (detailed below on the left) we can see how prices have evolved in Leeds, with the orange line showing the fluctuations in new build £/sqft values. These have effectively plateaued since early 2017, while
Herein Lies the Answer
There is a clear difference between the two markets in Birmingham and Leeds. While the new build property market in Birmingham has seen the effect of significantly higher price increases, the market for both new builds and secondary stock has seen a steadier increase. We can confidently conclude that this is ultimately what is behind the overall divergence in trends.
When was the last time these three cities experienced a similar divergence? In early 2008. Now there’s food for thought.
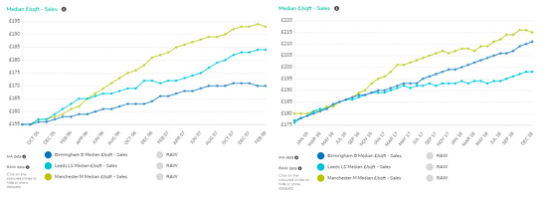
We’ll all be watching the shift in next quarter’s data for Birmingham, Leeds
Article originally published by REalyse.


