In recent weeks the debate about the significance of the flattening yield curve has reached fever pitch. Does a flat curve spell curtains for the US/UK economic expansion – and by extension, the global economic expansion? Can we hear the distant strains of the amply upholstered diva? Is this a golden moment to acquire bargain basement long-dated bonds?
My answer is no, no, thrice no! We have insufficient evidence that global economic momentum is faltering, especially in the light of the latest US national accounts data and the stimulatory policy announcements from China. As I argued in a previous article, past relationships suggest that US bond yields have further to rise to adjust to a strengthening nominal environment. Part of that is compensation for faster inflation, and part reflects an improvement in real economic growth. It would be quite extraordinary for an economic expansion to end with real interest rates – short and long – little above zero. The typical real interest rate achieved at the end of a post-war US tightening cycle has been 2, 3 or even 4 per cent. How can we be sure that US real interest rates – short and long – will not revisit positive territory before this economic expansion ends?
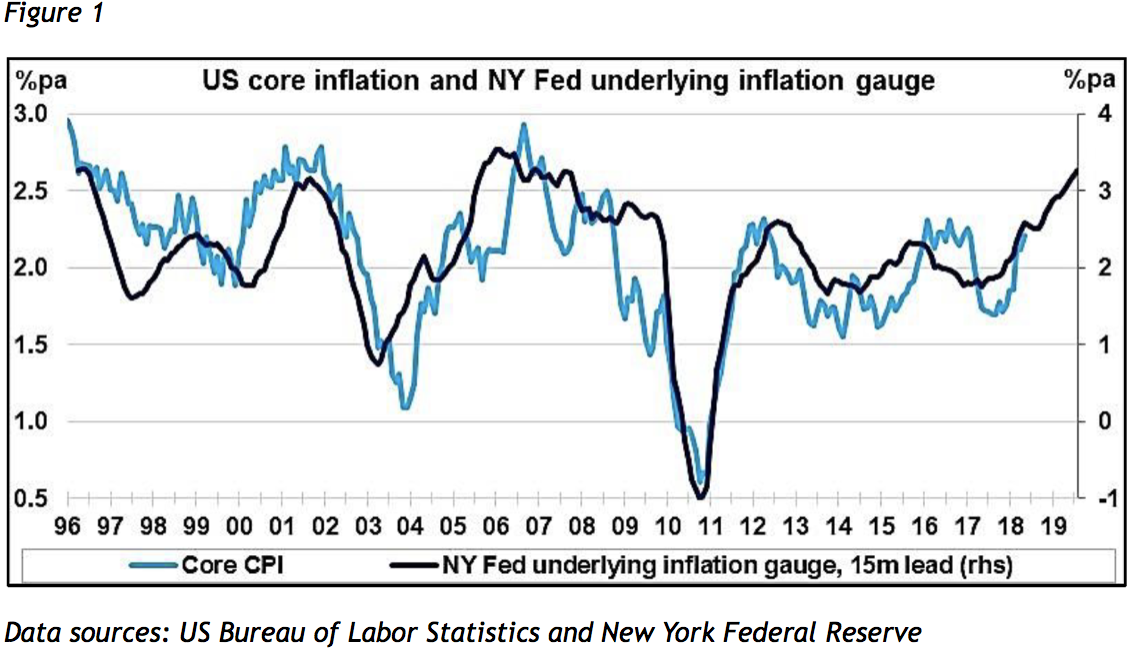
The alternative scenario, which we favour, is that the entire US yield curve has further to travel to adjust to an environment of 6 per cent to 7 percent nominal GDP growth. Not only could the FOMC extend its planned normalisation, in the light of positive economic surprises, but bond yields could create the room for that normalisation to occur in the context of an upward sloping curve. (Just imagine the Trump tweets that would ensue). As a bond investor, how would you wish to be positioned in the long-dated Treasury futures market if you entertained this suspicion? Or if you took the New York Fed’s underlying inflation gauge (figure 1) seriously? Or the Atlanta Fed’s wage tracker?

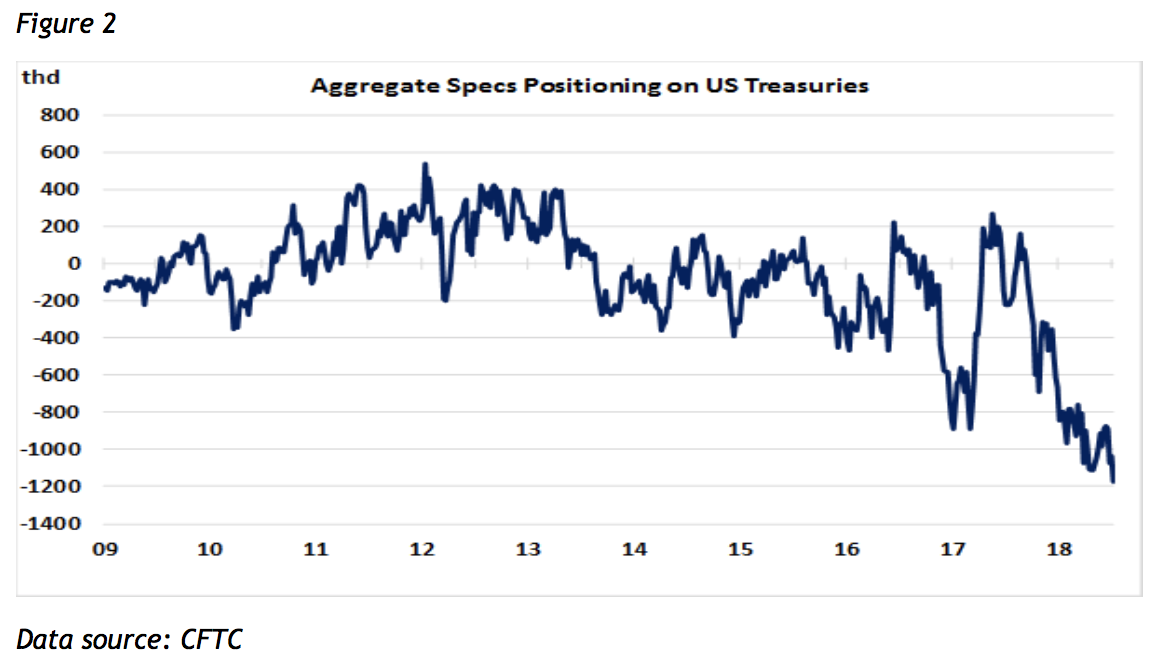
Figure 2 provides a rough-and-ready answer. Aggregate net positioning, in terms of numbers of contracts, has never been as negative as it is today, with these positions concentrated in the longer maturities. Tariff talk has diverted financial market attention from the here and now. Flatter yield curve natter has obscured the longer-term perspective on the determination of long bond yields and exposed bond investors – and property investors – to the risk of significant capital loss over the coming year.

Properly understood, central banks contain a branch of the intelligence services. They hold secrets, conduct covert operations, exact silent retribution on miscreants and facilitate invisible transactions. In extremis, they curate the rise and fall of domestic political regimes and individual careers. Occasionally they destabilise tyrannical regimes in far away places. (Should you ever be offered a job in a central bank, you should take it.) The only real difference between the US Federal Reserve and the Central Intelligence Agency, or between the Bank of England and MI5/MI6 is that central banks hold press conferences and publish information.
You might consider that to be a fatal flaw for a clandestine organisation, but clever people always find solutions. For central banks, the solution is the Script. The Script is a rolling narrative about economics and finance, that is plausible, memorable and technical. Plausible, because it has to fool journalists and other commentators and compel them to hang on every word of the chief communicator. Memorable, because it is important that the communicator can recite the message in his/her sleep and so that it becomes familiar to the journalists and commentators. Technical, because it must maintain a gap – sometimes a chasm – between the consumers of the information and the providers. This gap is invaluable when it comes to the Q&A sessions at press conferences and accountability hearings. Questioners must be made to feel inferior and inadequate in the presence of Great Minds.
There’s just one more thing about the Script. It bears almost no relationship to the actual internal policy discussion or the underlying motivation for the decisions made. Hence, after reaching an important decision, there follows a further round of discussion to consider the necessary amendment to the Script. The cornerstone of the prevailing Script is that the long end of the yield curve (embracing the 30-year and 10-year yields) is anchored by the central bank. Long-dated bonds are frequently described as ‘safe assets’ and their yields as ‘risk-free rates’. This is a major achievement of the Script. For when shorter-dated (2-year or 5-year) bond yields approach the anchored rate, it creates an appetite for government bonds. The apparent upside (from falling yields) is large, while the apparent downside (from rising yields) is small. This is the investment equivalent of the television show, “Play your cards right”.
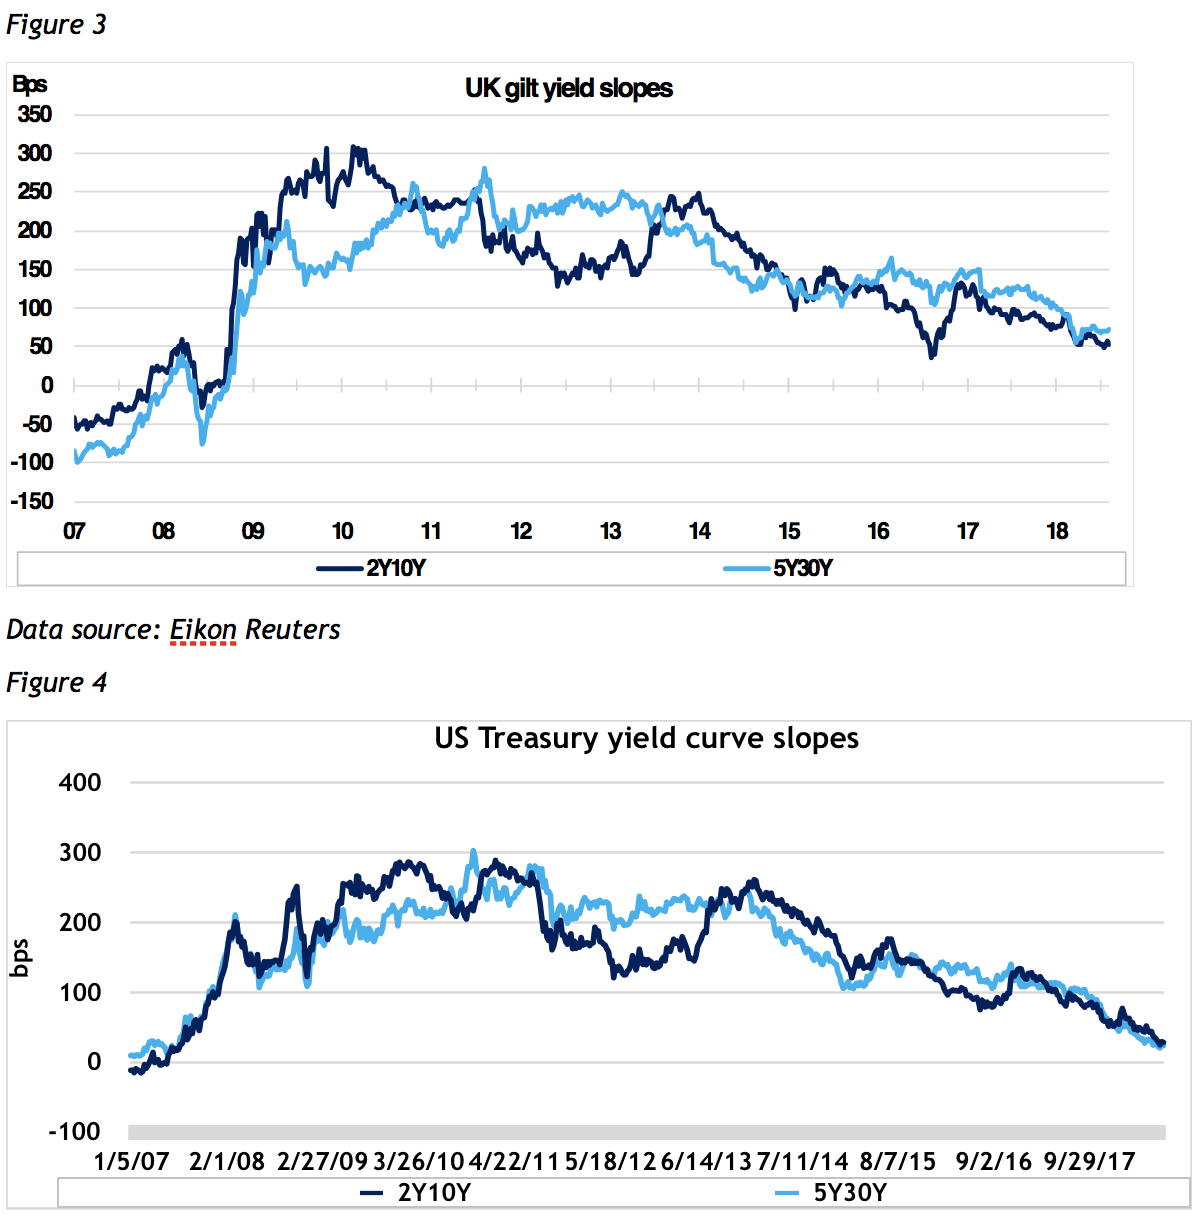
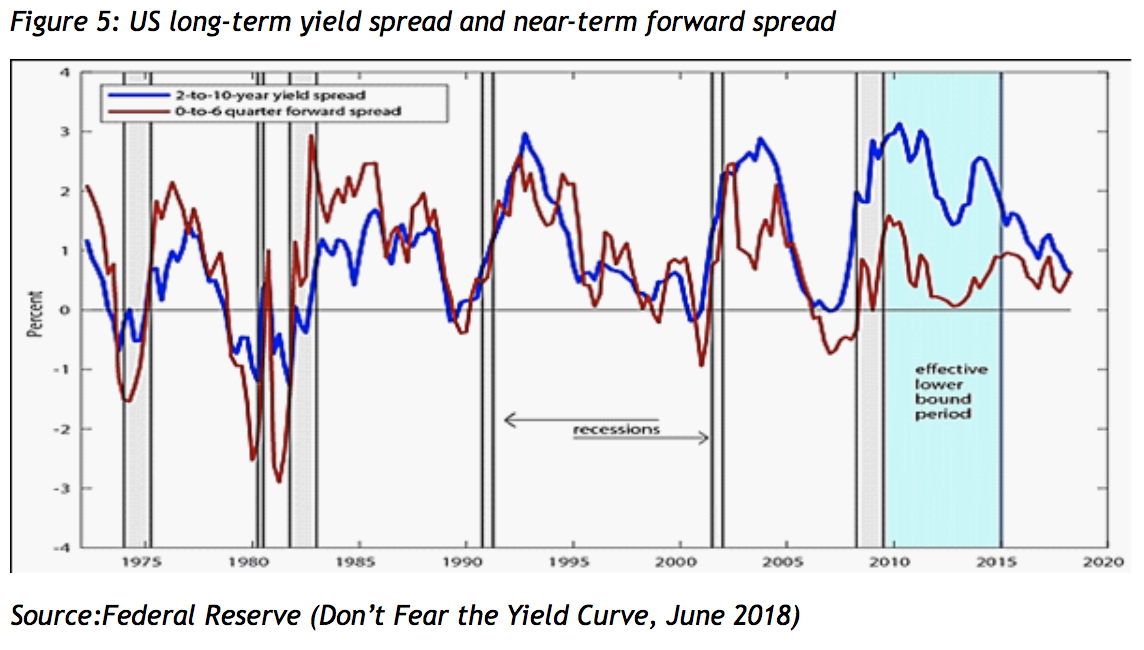
The Script explains that when short rates rise to meet long rates, the flattening of the curve presages an economic downturn. As the story goes, Interest rates across the whole yield curve have risen to the point where credit conditions are tight and the desire to borrow is curtailed. Figure 3 (UK) and figure 4 (US) trace the seemingly inexorable journeys of the 2-year,10-year and 5-year, 30-year spreads towards the dreaded zero line. At the zero line, the carry trade is dead, risk is off and investors are meant to scurry to the refuge of long-dated government bonds. The circular logic of today’s bond bulls requires that a near-3 per cent 10-year US Treasury bond yield (and a 1.5 per cent UK 10-year gilt yield) represent the outer limits of what our highly-indebted economic and financial systems can bear. As the 2-year yield (embodying the expected path of Fed funds rate increases over this horizon) rises towards this supposed boundary – often referred to as the terminal or neutral rate – then it is supposed that the economy will slow and that, within a short time, any inflationary pressures will abate.

Data source: Eikon Reuters
Thankfully, some brave souls have taken the trouble to question the validity of the flattening yield curve as an economic predictor. Researchers at the US Federal Reserve, no less, have uncovered an interesting fact: that the information contained in the forward rate curve over the next 18 months is superior to the 2-year, 10-year yield spread as a predictor of economic downturns (figure 5). This empirical result, based on 50 years’ data, reflects the traditional dominance of variations in short-term interest rates over those of long-term rates. In other words, the change in the 2-year, 10-year yield slope has been driven from the short end of the curve. Variations in 10-year yields were largely irrelevant.

How the world has changed! Since the mid-1990s, government bond markets have developed in size and scope and complexity such that the perceptions of bond market investors about the economic and financial environment – including the actions of policymakers – have become an independent source of variation in the slope of the yield curve.
There was once a time when the flattening of the yield curve was a reliable – but never infallible – precursor to slowing economic activity. Today, we have bull flatteners (where long-term rates fall relative to short-term rates) as well as bear flatteners (where short-term rates rise to meet long-term rates) and there is no clear economic inference. The emphasis has shifted from policy behaviour, influencing the path of short-term interest rates and rippling out to long-term rates, to investor positioning along the yield curve. Investor positioning, in turn has become distorted by the post-2009 regime of zero interest rates, central bank asset purchases and forward guidance.
What the Fed researchers confirmed was that the near-term yield slope is simply a re-expression of the forward guidance on interest rates that the central bank has provided to the market. In the case of the US, it is known as the dot-plots, updated each quarter. In other words, in our ‘Hall of Mirrors’ world of unconventional monetary policy, the slope of the yield reflects market perceptions of the path of short-term interest rates, conditional on the forward guidance offered by central banks. The US and UK yield curves are flattening because central banks have guided the market to believe that we are close to this mythical terminal rate. The information value of the yield curve has evaporated, in respect of future economic developments.


