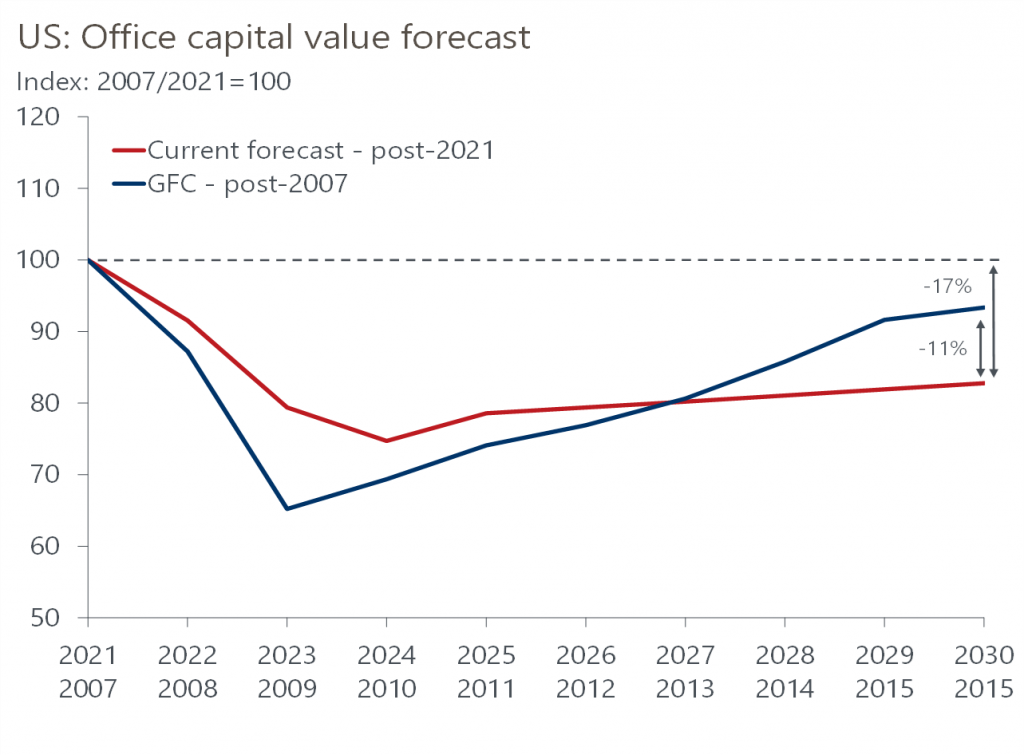
US office capital value will be 17% below 2021 values by 2030.
Having just passed the three-year anniversary of the Covid lockdowns, it is a good moment to take stock of the impact of the pandemic on US office space. Overall, the shift to working from home following the Covid lockdowns has had a clear impact on real estate. For apartments, some renters are looking for more space to include a home office or workspace, while downtown retailers have been negatively affected by lower foot traffic. But it is the office sector in particular that has borne the brunt of the WFH impact.
Just as with retail after the global financial crisis, office markets and office properties will perform differently under headwinds from the WFH movement in the coming quarters. The near-term outlook for offices will be dominated by a looming recession at the end of this year and tightening lending standards. So, assessing office performance might help to understand how specific markets and assets will weather the impending economic uncertainty.
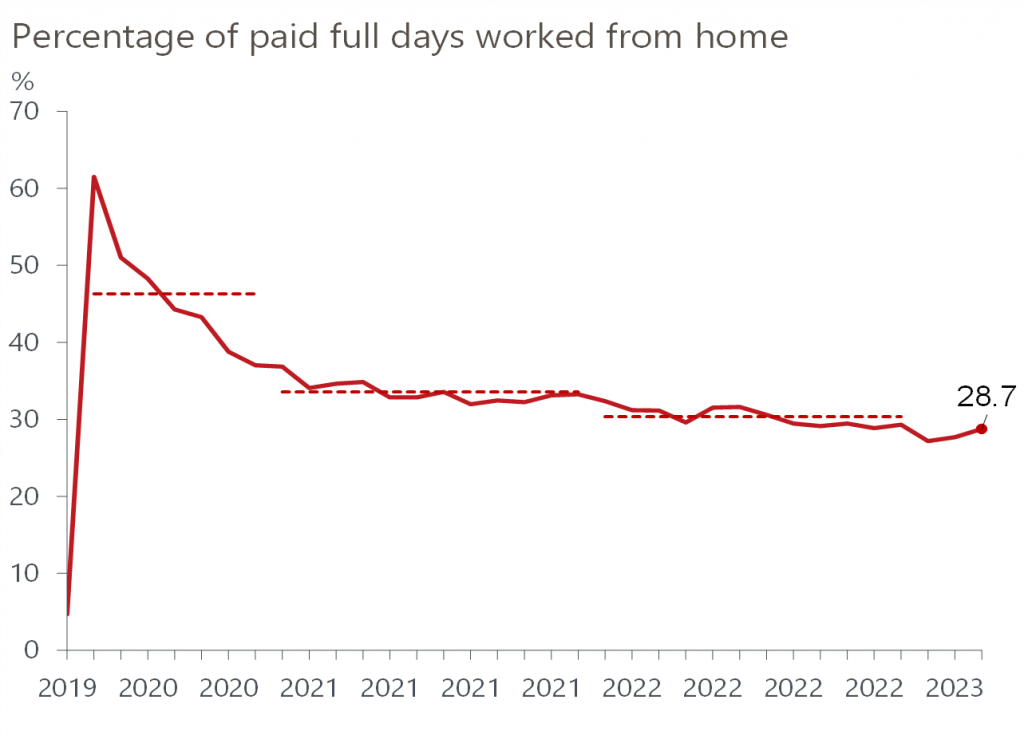
Focusing first on how the WFH shift has progressed since the onset of the pandemic, according to data from WFH Research and NBER, the percentage of paid full days worked from home has decelerated to 28.7% as of March 2023. This follows a spike in early 2020 of 61.5%. Interestingly, the latest figure, while below the 2022 average of 30.3%, has risen from 27.2% in January this year. On average, the rate has fallen each year since the start of the series in 2020 but has hovered close to 30% since the start of 2022. Tech (2.34 days per week), finance (2.19 days per week), and professional and business services (1.98 days per week) are the employment sectors with the highest prevalence when it comes to number of days employees work from home.
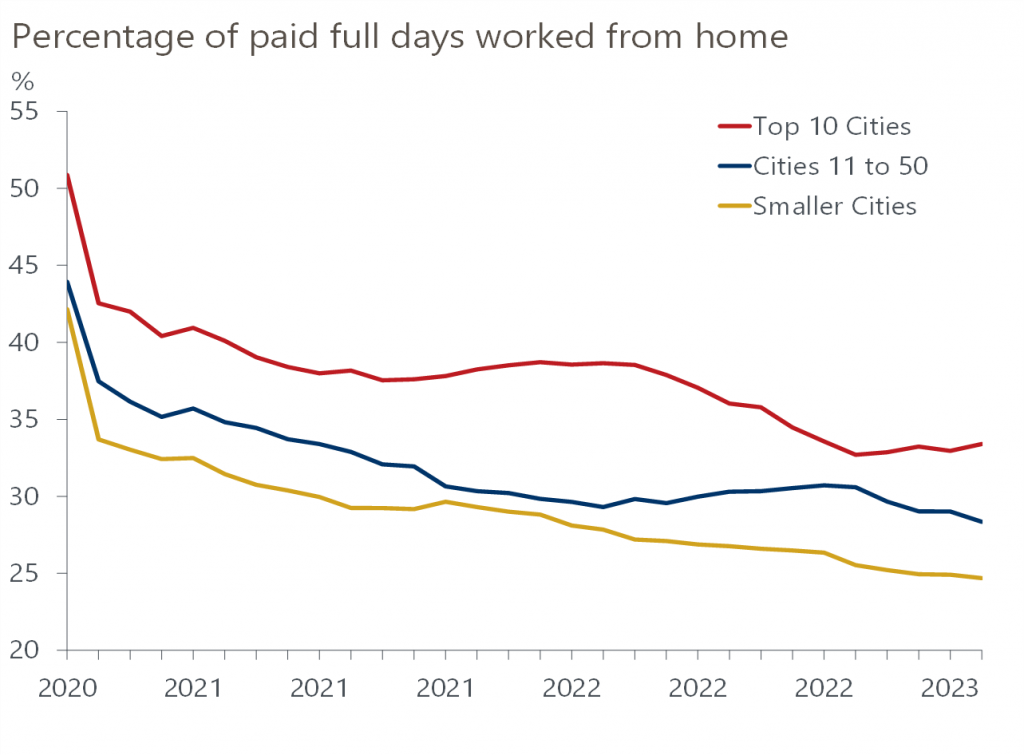
Breaking down the broad US trends, there is a divergence of WFH adoption among cities. Looking at cities by population size – the top 10, the next largest 11 through 50, and smaller cities – the percent of paid full days worked from home, like the broader US, has been trending down since 2020. According to the data from WFH Research and NBER, larger cities recorded the highest rate, at 33.4% as of March 2023, while the smallest cities recorded the lowest rate at 24.7%. Do these trends translate directly to office space fundamentals?
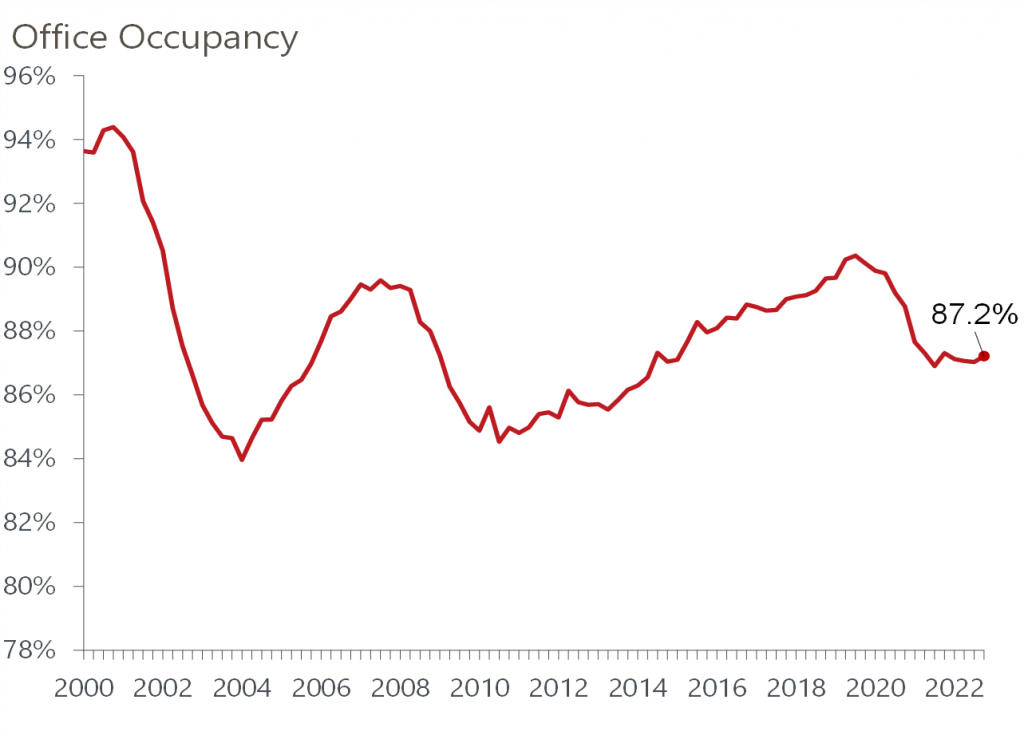
Overall, office occupancy in the US has dropped by around 300bps peak-to-trough over the past few years, according to data from NCREIF. This comes on the heels of a consistent upward trend in occupancy during the last decade. Since occupancy hit a near-term low in 2021 (around 87%), the rate has stabilized and hovered close to that rate in recent quarters. Safe to say, the drop in occupancy that began in Q4 2019 has been impacted by the WFH movement during the pandemic, and so far, office properties have struggled to absorb that vacant space.
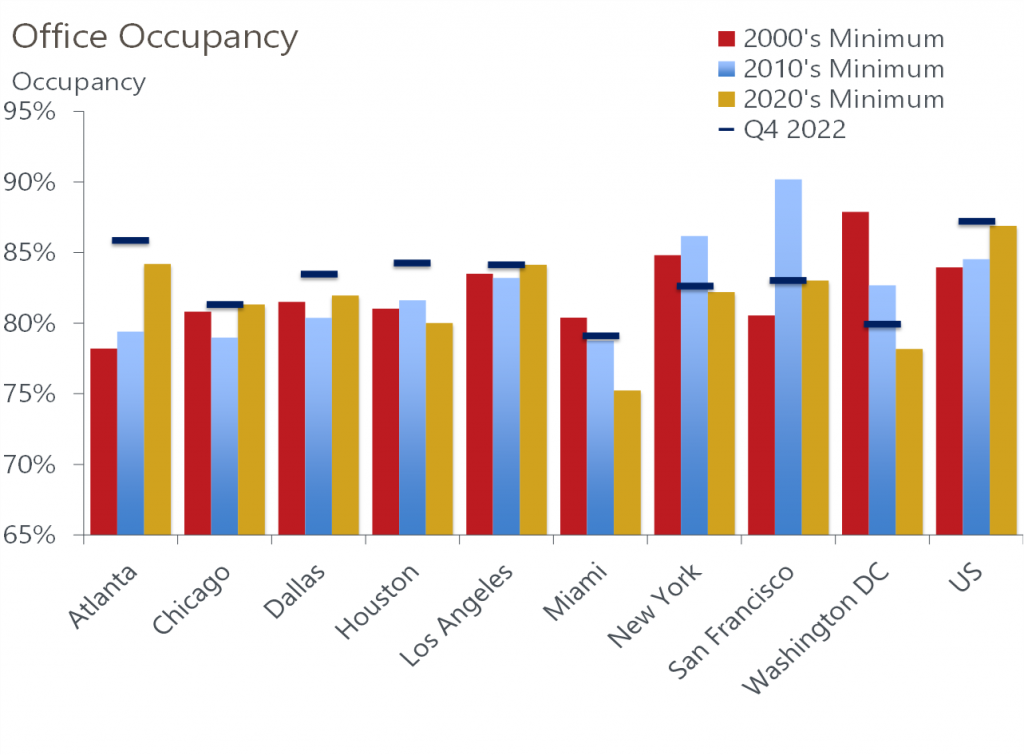
In terms of occupancy performance across some of the major markets, it is a mixed bag. We compared occupancy lows across the recent decades (2000s, 2010s, and the last three years) to the most current office occupancy to identify some of the recent WFH impacts. Of the nine major markets included in our analysis, four – Miami, New York, San Francisco, Washington DC – have a Q4 2022 occupancy that either falls below the lows recorded in the 2000s, or the lows recorded in the 2010s, or both. These markets diverge from the US and others that we track.
As of Q4 2022, the US office occupancy rate is above all three of its decade lows – a similar trend is occurring in Atlanta, Dallas, and Houston. Houston’s occupancy is currently over 400bps above its 2020s low, which is the widest spread among the markets we analysed. Looking ahead to the economic headwinds facing the office sector in 2023, markets such as Atlanta, Dallas, and Houston appear to be in a better position heading into a downturn. However, markets such as Chicago, New York, and San Francisco that have occupancy hovering close to the recent lows will likely struggle more in the near-term.
The sublet vacancy data from Cushman & Wakefield validates the potential for downside risks in some office markets. Markets such as Chicago and Manhattan are reporting sublet vacancy in Q4 2022 two times higher than what it was at year-end 2019. For San Francisco, the sublet vacancy rate is 500bps higher. Houston, while recording an elevated sublet vacancy compared to some of the other major markets, has a rate 10bps lower in 2022 compared to 2019.
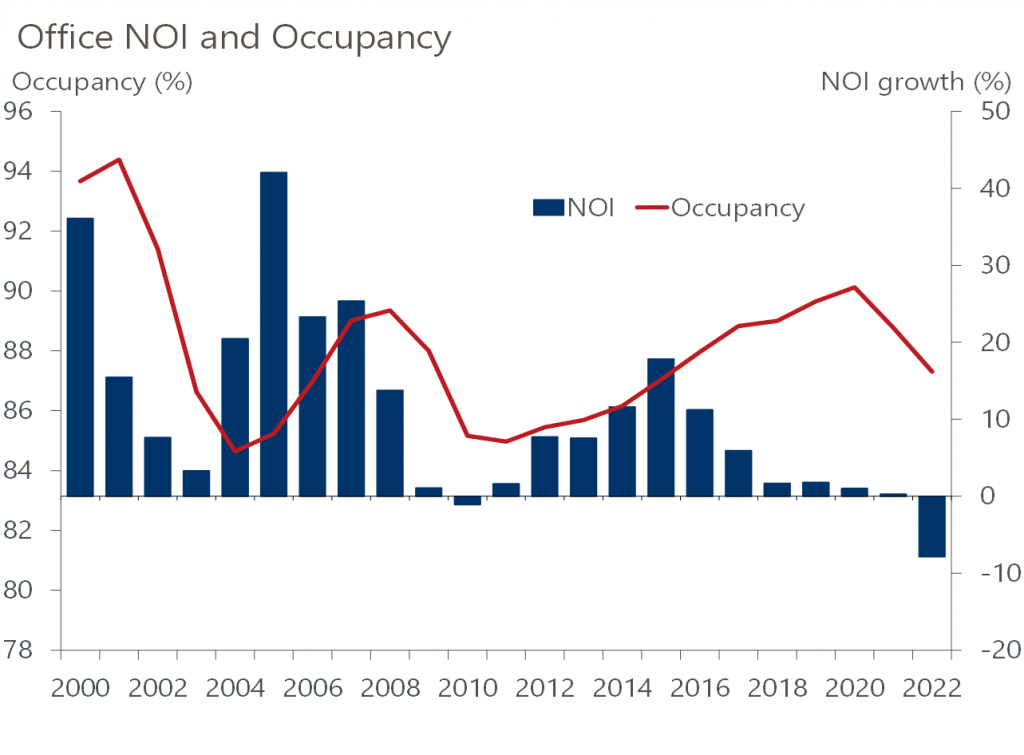
How might these occupancy trends influence investment performance? The relationship between office occupancy and office net operating income (NOI) offers some answers. There is a strong positive relationship between changes in occupancy and NOI growth. For example, following the dot-com downturn in the early 2000s, both occupancy and NOI recorded a significant recovery. A similar trend occurred following the GFC. Leading up to the pandemic, occupancy stabilized at close to 90% in 2016, and NOI gains started to slow. Over the past few years, NOI has dipped into negative territory as occupancy began to drop. The decline in NOI was close to 8% in 2022, the largest drop in the MSCI’s multi-decade history.
In 2022, lending margins for offices moved out by 48bps and cap rates increased by 30bps. We estimate that there is a funding shortfall of 31% for an average 2018-vintage US office asset. We are now seeing some signs of pricing movement, but in 2022 the number of distressed sales remained low.
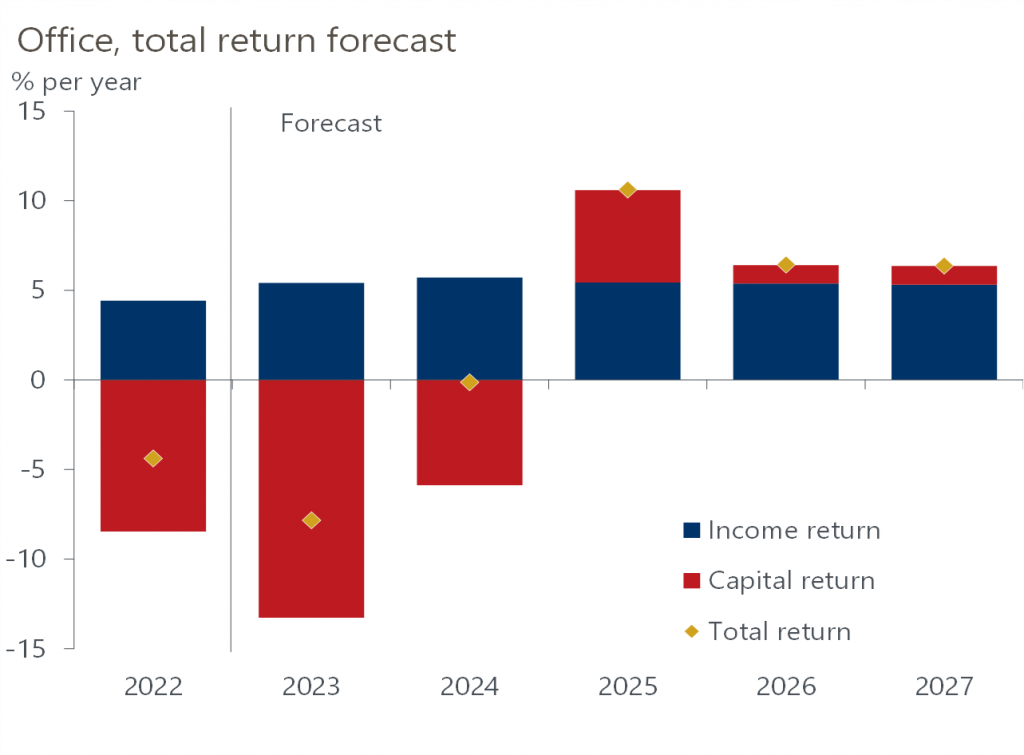
Following declines in 2022 total returns for offices – the only sector to record a decline – our forecast anticipates the sector will record the lowest total return in 2023. Our forecast is driven by monetary tightening and the impending recession, but the impact from WFH on the office sector and office performance is certainly an underlying driver of the recent and near-term performance struggles for the sector.
In Europe, due to return to office rates hovering close to 70% in most cities (London is reported to be lower, at 50%), occupancy, albeit declining, remains well above rates recorded in the US. In addition, with office tenants demanding higher quality space, Class A space in many Europe CBDs remains constrained. We forecast a correction in Europe’s office sector in 2023. But given these stronger fundamentals, the decline will be significantly less than the US.
Absent another global pandemic, the impact from WFH across the office sector has likely stabilized. That said, remote working is just one factor influencing market office performance. Other factors include employment sector concentration, demographics, affordability, oversaturation of office space, and the age of office buildings.
We expect the structural shift to working from home to continue to negatively impact the US office sector over the long term. Our capital value forecast for all US offices by the end of the decade is 17% below 2021 values. In recent months, the adoption of WFH has settled to around 30% of paid full days. But the lagging effect of leases and over-supply will drag on market performance for some time. With 30% of employees working from home and office tenants focusing on right-sizing their space rather than expanding, we think office occupancy rates are unlikely to rebound strongly this year.
Headwinds from weaker occupancy rates, coupled with monetary tightening and the weaker economy in 2023 will cause certain office markets to struggle more in the near-term. Most affected are Chicago, New York, and San Francisco which have occupancy hovering close to recent lows. Atlanta, Dallas, and Houston are relative winners as they are in a better position to weather downside risks in 2023.


