


Some readers may be familiar with Liu Cixin’s award-winning 2008 science fiction novel The Three-Body Problem or its 2024 Netflix adaptation. Either version provides a fitting backdrop for today’s article
For the uninitiated, the Three-Body Problem is a classical mechanics puzzle that examines the unpredictable interactions between three celestial bodies (e.g. planets) in orbit. While the orbits of two bodies can be precisely calculated, introducing a third creates a chaotic and highly unpredictable system
This analogy offers a valuable framework for understanding real estate performance. Here, the three celestial bodies represent the primary drivers of performance: income return, rental growth, and yield impact. Each exerts its own gravitational influence on total returns by interacting dynamically with the others – and not always in a consistent way through the cycle. As a result, to the uninitiated, real estate may sometimes appear as unpredictable and chaotic as the Three-Body Problem.
“The universe is under no obligation to make sense to you”, Neil deGrasse Tyson
Each of these variables has distinct characteristics: Income returns are steady, predictable, and form the primary contributor to total returns over the long term. Rental growth reacts slowly and moderately to occupier demand. And yield impact is highly sensitive to investor sentiment and relative pricing, leading to oftentimes rapid and significant fluctuations.
I will examine these well-established relationships in two ways; the first employs relatively straightforward statistics that will be familiar to many of you, whilst the second uses some more involved machine learning that may not be.
“It has enabled us to evolve into the dominant species on the planet”, X-Men
From 2001 to 2024, UK income returns averaged 1.35% per quarter, accounting for 80% of total returns over this period. By contrast, yield impact averaged just 0.03% per quarter, appearing inconsequential in this straightforward calculation.
However, in practical terms, from an investor’s perspective, this would assume a long-term hold strategy, ignoring the pronounced cyclical swings in yields and rental growth that shape market cycles. This is unrealistic for most investors, and so we need to approach the problem in a more thoughtful way.
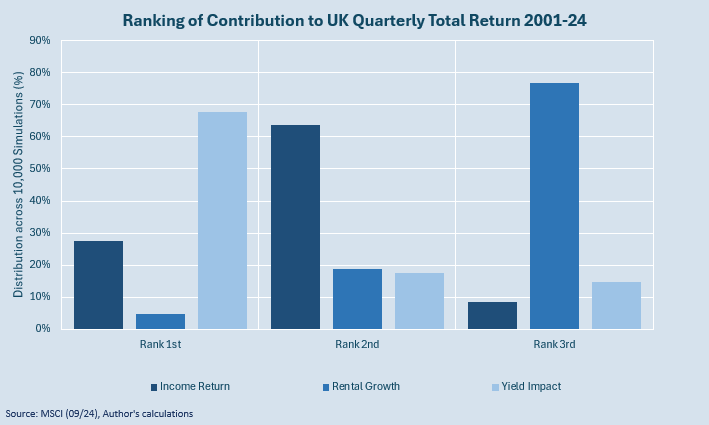
I conducted 10,000 simple random simulations based on the historic mean and standard deviation of our three variables. The results, highlighted in the chart below, suggest a more complex narrative, but it is also a more realistic one that encapsulates the cyclicality of the asset class: Yield impact is most frequently the dominant driver of total returns, while income returns rank second. Rental growth consistently remains the least influential.
In our Three-Body Problem analogy, these two analytical approaches are akin to estimating the sizes – and therefore gravitational pull – of the three planets. The first approach finds that income return is the largest celestial body, whilst the second suggests that it is yield impact.
So, which is it? We’re only part of the way through our analysis, yet there already appears to be some contradiction in our real estate universe. Clearly, performance can not be fully explained by a single unifying theory of everything.
“I am reading fluctuations in their power grid”, Star Trek: First Contact
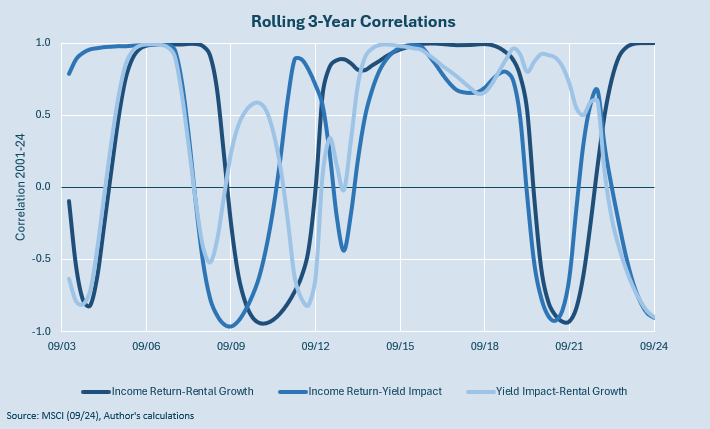
Just as important as the size of our three variables is the interaction between them. In our cosmic analogy, this would be represented by the orbits of the celestial bodies. Put simply, what are the correlations of our three pairings? If they are stable over time, then this makes for predictable trends/orbits.
Alas, this is not the case. Rolling three-year correlations reveal that the relationships – whether positive or negative – are often strong but short-lived, frequently switching to the opposite extreme. This volatility is particularly evident in the correlations between income returns and the other two variables. The relationship between yield impact and rental growth is slightly more nuanced, but still highly volatile.
These correlations aren’t fluctuating randomly, of course. They are following an internal logic. But unless investors have perfect foresight, the fact that these relationships are changeable means that they cannot be relied on for all types of investment strategies or across all time periods.
“Prosperity is the best protector of principle”, Mark Twain
Thus far, our system is proving to be chaotic, but our methods have been rather simplistic. Perhaps analysing a complex system necessitates a more complex approach? Non-researchers may prefer to skip to the concluding paragraphs.
Principal Component Analysis is a machine learning technique used to uncover patterns in data by reducing complexity while retaining key information. In doing this, we can understand what is truly driving a particular trend. I’ll spare you the calculations1, and jump straight to the findings:
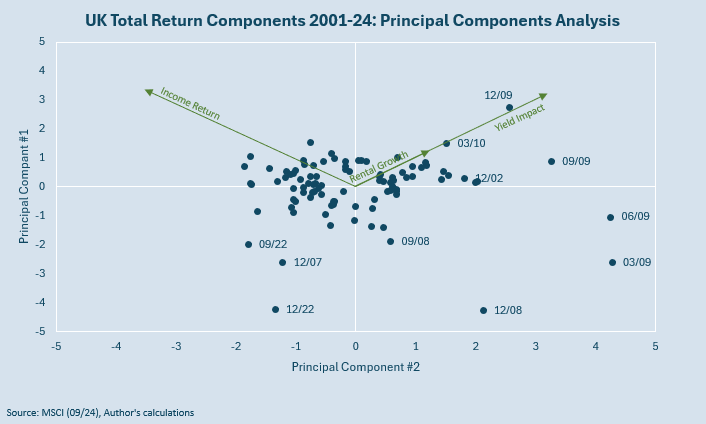
- Had I found that one single Principal Component (PC) explained nearly all the variance in the data, we would be operating in a stable and predictable system. However, in my analysis, our real estate universe requires three PCs to capture all of the variance: PC#1 accounted for as much as 50%, with PC#2 adding an additional 36% explanation. This reflects the dual dominance of income returns and yield impact seen in the earlier analysis2.
- The two PCs also contradict each other. In PC#1, both income return and yield impact have strong positive relationships. But in PC#2, yield impact remains positive whilst income return flips to negative. This mirrors the fluctuating correlations uncovered by our earlier approach. It seems as if both PCs #1 and #2 strongly influence the observed trends in performance over time, but in very different ways.
- When plotted visually below, the relationships between PC#1 and PC#2 become clearer. For most observations between 2001-24 there is a strong clustering around the centre of the chart. The signs flip from positive to negative, representing the fluctuating relationships over time. We also note several outliers, which are the stages of the cycle when the market troughed3.
Having two dominant (and one subdominant) and oftentimes competing and fluctuating forces in our real estate universe explain the perceived chaos and unpredictability of its performance over time.
“I can calculate the motion of heavenly bodies, but not the madness of people”, Isaac Newton
The Three-Body Problem serves as a compelling analogy for real estate performance, particularly for those drawn to astrophysics or science fiction. More importantly, it underscores the challenges our industry faces in predicting performance amidst unpredictable and fluctuating forces.
For investors, what to do with this knowledge is another problem entirely. Suffice to say that focussing on any one driver of performance is a high-risk strategy. There should be some recognition, even in low-risk or evergreen strategies, that the drivers of performance will change depending on the stage of the cycle, and that it is best to diversify across a number of performance drivers.
Sometimes a single driver is absolutely central to an investment strategy, for example Core investors focussed on income. In these instances, they should mitigate risk by holding assets for very long periods, ignoring cyclical fluctuations as far as possible.
Higher Return investors may also by singularly reliant on positive yield impact to drive returns. They will need to be disciplined, decisive, and fleet-of-foot, as there is little margin for error in their entry and exit timings. They need to be in and out of the market before those relationships flip.
1 For those that are interested, the process involves looking at the Covariance of the standardised time series of our three variables, before converting them into Eigenvalues, Eigenvectors and finally Principal Component Scores.
2 A third PC#3 was the least influential, responsible for only 14% of the total variance.
3 The Dotcom bust in 2002, the Global Financial Crisis in 2008/09, and the Cost-of-Living Crisis in 2022.
Originally published by the My R.E. Education and reprinted here with permission.


