


Buy low, sell high? It’s that simple, right?
Of course, we know that it isn’t. But there are some simple heuristics that investors use when deciding whether to invest into real estate or not. One of these is whether real estate worth the risk given the alternatives. In other words, does the expected return from real estate exceed that of the risk-free rate plus an appropriate risk premium?
But do investors actually listen to what this signal is telling us? I don’t just mean those explicitly calculating fair value. Whether they have a sophisticated model or not, experienced operators will all have their own assumptions or rules-of-thumb for entry and exit yields, income and rental growth, depreciation, running costs; all of which is a fair value model in everything but name.
The question I want to explore is whether they pay attention to these signals.
“We will expect fair value in return,” Pirates of the Caribbean: At World’s End
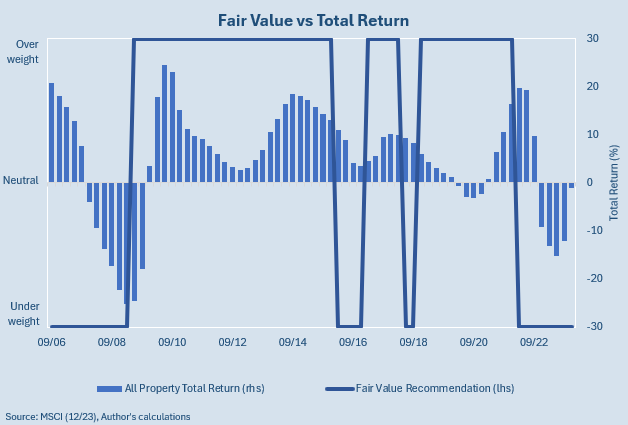
There is no single approach to estimating fair value, and it is in the small differences where canny investors will operate. Yet the high-level signals do a good job in capturing the risk on/off sentiment towards real estate. The chart below shows how the switch between overweight and underweight recommendations generally move in line with (or slightly anticipate) trends in UK total returns.
“A rescue attempt would be illogical,” Star Trek
This left me wondering whether buying and selling activity followed the same trends. It would seem logical for trading to slow when real estate becomes too expensive for its prospective returns, and similarly revive when the outlook brightened again.
Then again, we know that investors are not perfectly logical operators. Having spent considerable time and money raising a new fund, would a manager stop deploying that capital if market prospects soured? Would a specialist retail developer halt all activity when their sector falls out of favour? Would a fund manager turn all of its assets into cash if it saw a market crash coming?
My experience is that many investors will slightly but not drastically modify their future plans, in hope rather than expectation that they will not be affected. Usually investors expect a slope when, in fact, there is a cliff. They do not see – or perhaps choose to ignore – the signals, and proceed to run off the cliff without looking down, as is often depicted in cartoons.

The chart above compares the fair value assessment from earlier against a measure of market activity; investment volumes relative to their average of the preceding five years. The pattern is not dissimilar to the previous chart but, as expected, the correlation is weaker. I’ve highlighted where the fair value signal does not match investment activity (dark blue columns), which makes very apparent the lag in the transactional market. This is where investors – as a market entity – are being irrational.
“I have opinions of my own… but I don’t always agree with them,” George H.W. Bush
Translating the above chart into a simple matrix helps with clarity. When the signals from the fair value assessment and investment activity pointed in the same direction during the same quarter (light blue columns), I recorded this as an agreement. Where they didn’t (dark blue columns), it was noted down as a disagreement.
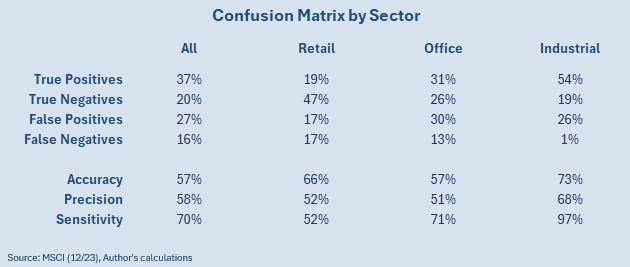
An overall agreement of 57% for the 2006-23 period is lower than I would have expected before undertaking the analysis. However, at the sector level, the findings are generally more positive. As we know, much of the post-GFC UK real estate story has been about the fall of Retail and the rise of Industrials; their agreement percentages were much higher, at 66% and 73% respectively.

“I’m sorry, son, but you must have me confused with someone else,” Airplane!
Let’s delve into this further with a confusion matrix. Predictive analytics and machine learning often employ these, as they have more explanatory power than the simple matrix above.
For example, imagine a model that correctly predicted 90 times out of 100 whether your supermarket would have either of apples or oranges in stock at the time of your visit. A confusion matrix could clarify that the model was actually correct for 50 out of 50 of the predictions for apples but only 40 out of 50 for oranges, implying there was some room for improvement to the orange-predicting algorithm but not the apple one.
For our real estate analysis, we have four possible outcomes:
- True Positives, where an overweight recommendation was matched by above-average investment activity.
- True Negatives, where an underweight recommendation was matched by below-average investment activity.
- False Positives, where an overweight recommendation was matched by below-average investment activity.
- False Negatives, where an underweight recommendation was matched by above-average investment activity.
Each outcome in isolation still has limited explanatory power. For example, the True Positives for Retail (19%) are much lower than those for Office (31%) and Industrial (54%). But that is not necessarily a weak model; we must factor in that overweight recommendations were far less frequent for this sector, given the significant challenges it faced over the period in question. We therefore need to look at the True Negatives too, where Retail did far better (47%). The combined accuracy score takes both of these into account, and shows us that Retail actually outperformed Offices in this model.
On the flipside of the same coin, Industrials gave us hardly any False Negatives (1%), partly because it was recommended as an overweight so frequently (80% of occasions) during the years in question. Either way, from the high accuracy score (73%) we learn that investor activity in Industrials more closely tracked the macro signals than for the other sectors.
“Only when the tide goes out do you learn who has been swimming naked,” Warren Buffet
The 57% accuracy overall is precisely in line with our simple agree/disagree matrix. And, yet, it is hardly worth getting excited about. After all, statistically the relationship is only slightly above chance. The usual caveats about the limitations of the data and methodology aside, from this we learn that investors may not be willing (or perhaps able) to heed the macro signals. At least, not until you get down to the sector level.
This begs the question whether asset allocators who only/first evaluate real estate at the All Property level may miss golden opportunities presented by the best individual sectors going forward. Real estate in its entirety may not fare well against other real assets or private equity, but individual sectors almost certainly will.
“The four most dangerous words in investing are ‘this time it’s different’,” Sir John Templeton
We can look in more detail at the timings of the disagreements at the All Property level to see if they shed any light on the matter. And, from what this shows, behavioural factors may have been at fault.
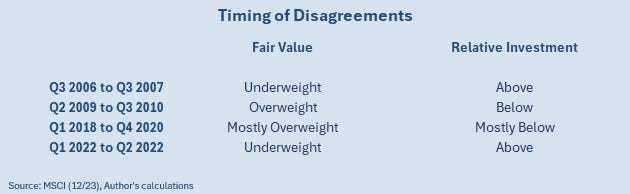
It does appear that the fair value analysis was warning of a market correction some way ahead of the GFC, and that this was largely ignored. When times are good, it is hard to dispassionately assess risk.
Subsequently, investors were slow to get back into the market trough that followed, despite the potential being clear. This may not have been due to lack of trying, but because of the considerable challenge in raising capital at that particular point in time. The negativity bias and loss aversion by recently-affected investors would have been insurmountable for many.
“My biggest weakness is my sensitivity. I am too sensitive a person,” Mike Tyson
Anyone who reads this blog regularly knows that I am not for blindly following the data. But I am also aware that we should sometimes heed its advice more closely than we do, especially when our subjective views are likely to have been compromised.
This may be particularly pertinent over the next cycle. With a higher risk-free rate going forward making real estate’s fair value analysis far more sensitive than it was during the post-GFC period of low interest rates, my belief is that ignoring the macro signals could lead to many more unforced errors.
This article was originally published in My R. E. Education and is republished here with permission.


