Comparing returns, and risk, for debt markets across Europe has historically been nigh-on impossible due to a lack of data. But new research from CBRE will help existing and new lenders determine strategy from a position of greater understanding. The data show that returns vary significantly across markets, and – contrary to perceived wisdom – there are pockets of Europe where typical lending terms are looking increasingly stretched, meaning lenders should proceed with care.
The European real estate debt market is, we estimate, roughly a €1trillion industry. As with so many huge industries currently, it is also undergoing a significant period of disruption – in this case as incumbent operators grapple with legacy positions and (often) new or increasingly onerous regulatory regimes, while challengers come into the sector to try to gain market share. With the market in flux, and with all participants seeking to make allocation decisions from a position of deep understanding of the rewards on offer and the risks involved, it is vital that a market that historically has not been well provided with publicly available data gathers all the tools it can.
To this end, we recently updated and expanded our European Debt Map, which now details Q4 2017 lending terms for senior, whole loan and mezzanine debt on prime office, retail, logistics investment (and, in the case of office, development) assets in 20 capital cities across Europe. With the popularity of real estate debt getting ever stronger among both traditional lenders and new entrants to the sector, this publication provides truly crucial data, not available elsewhere, on which lenders can develop their strategy. It speaks of a market in rude health, offering extremely attractive returns, but one where lenders should operate with a note of caution in some markets where risks have increased.
Interactive CBRE European debt map – click to launch map.
Figure 1 shows the cost of debt, split into component parts, for prime office lending in 20 capital cities across Europe. For borrowers this represents typical financing costs, but for lenders this represents typical returns.
- Of the larger markets (in terms of investment market size), returns are considerably higher in London (2.65%) and Rome (2.22%) than in Berlin (1.42%) and Paris (1.52%).
- Of the Western Euro-denominated markets, the highest returns are to be had in Dublin (2.72%), Madrid (2.52%) and Lisbon (2.42%).
- CEE, as might be expected of less liquid emerging markets, sees the highest returns; Bucharest and Warsaw at c5%, Prague at c4% and Budapest and Bratislava at c3%.
The level of return on offer is only part of the consideration for lenders, risk being the other. Broadly, lenders would want to avoid the risk of a default on interest payments (an “income-driven default”) and the risk of capital loss in the event of an LTV default (a “value-driven default”). It is possible to quantify and compare the extent to which these risks are present in each of the 20 capital cities by looking at the Interest Cover Ratio (income-driven default) and the Debt Yield (value-driven default).
Figure 1 Cost of senior debt, prime capital city offices, Q4 2017
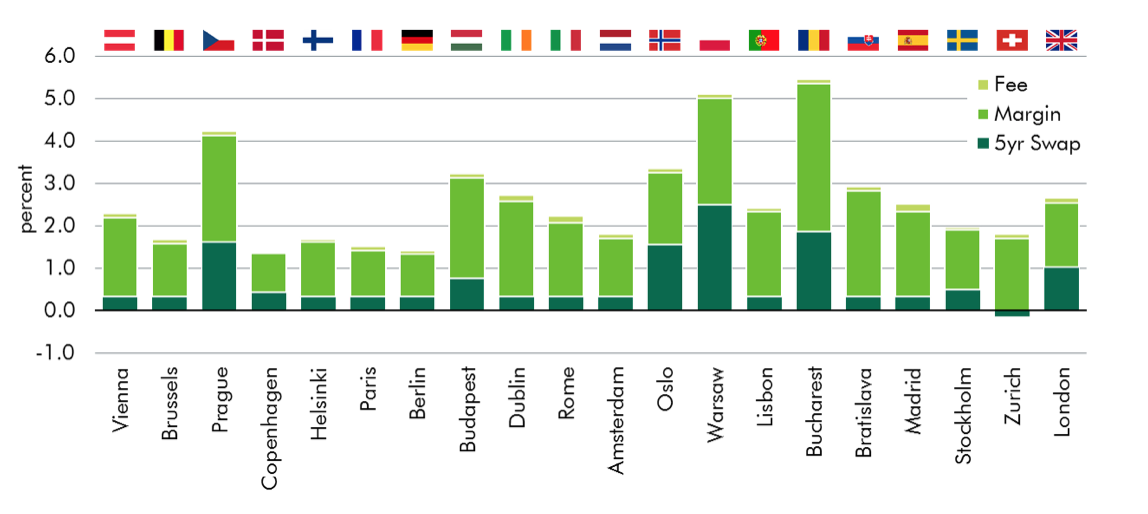
Source: CBRE, Macrobond. Assumes cost of debt comprises local five year swap rate (as at Dec-17), margin, and arrangement fee (apportioned over the life of the loan).
Figure 2 shows the Interest Cover Ratio (ICR) for prime capital city office lending in 20 European capital cities. The ICR reflects the amount of times the income from a property covers the interest on the debt on a property. A higher number is thus lower risk, and any number above 1.0 indicates that income is greater than interest payments.
Figure 2 Interest Cover Ratio on senior debt, prime capital city offices, Q4 2017
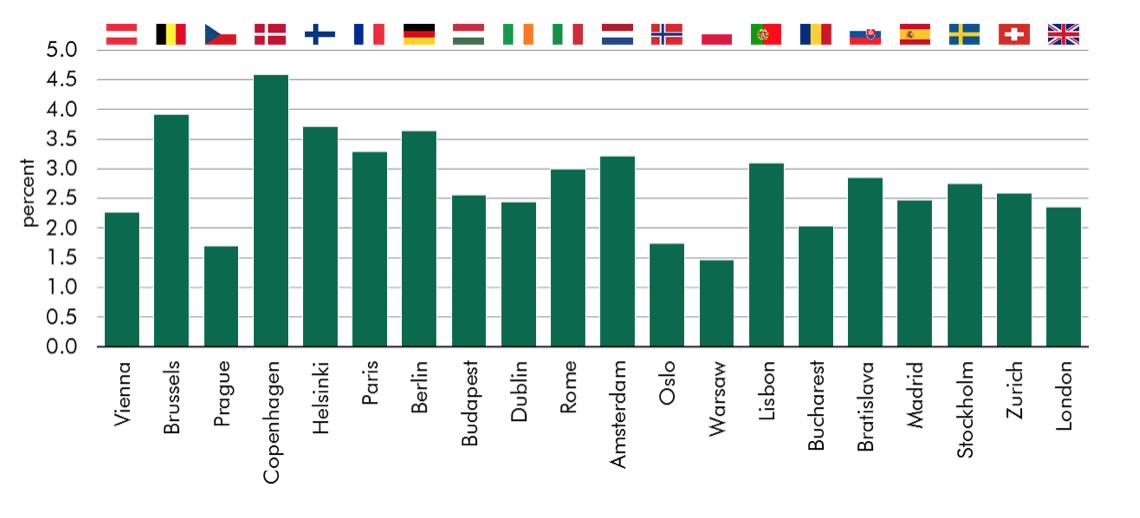
Source: CBRE. Calculated as ratio of property yield (income) to interest payments (total cost of debt multiplied by LTV).
On this measure, lending terms across all cities appear very low risk – a reflection of lower cost of debt (especially interest rates) and often moderate LTV levels – and would support the argument that lending has remained disciplined so far in this cycle.
- Eight cities (40% of the total) have an ICR of 3.00 or above, including Berlin (3.64), Paris (3.29) and Rome (3.00). The other five – Brussels, Copenhagen, Helsinki, Amsterdam and Madrid – are all mature Western markets.
- Three cities have an ICR below 2.0. Two are CEE markets, Warsaw (1.47) and Prague (1.70), the third being Oslo (1.74).
- The remaining nine cities, including London (2.36), have an ICR between 2.00 and 3.00.
Figure 3 illustrates the Debt Yield for prime capital city office lending in 20 European capital cities. The Debt Yield adjusts the property yield for the LTV (so, for example, a property yielding 3% with debt of 60% LTV would have a Debt Yield of 5%) and effectively measures the yield at which the lender could be said to have “bought” the property, should it pass to the lender in the event say of a capital default. A higher number may be considered lower risk therefore: if the lender “buys” at a higher Debt Yield, there is less downside risk than if they “buy” at a lower Debt Yield.
- Seven cities have a Debt Yield below 6.00%. These include Berlin (5.00%) and Paris (5.12%) of the large markets.
- Six cities have a Debt Yield above 8.00%, including all five CEE markets – Prague, Budapest, Warsaw, Bucharest and Bratislava – and Lisbon.
- The remaining seven cities have a Debt Yield of 6-7%, including Rome (6.67%) and London (6.25%).
Figure 3 Debt Yield on senior debt, prime capital city offices, Q4 2017
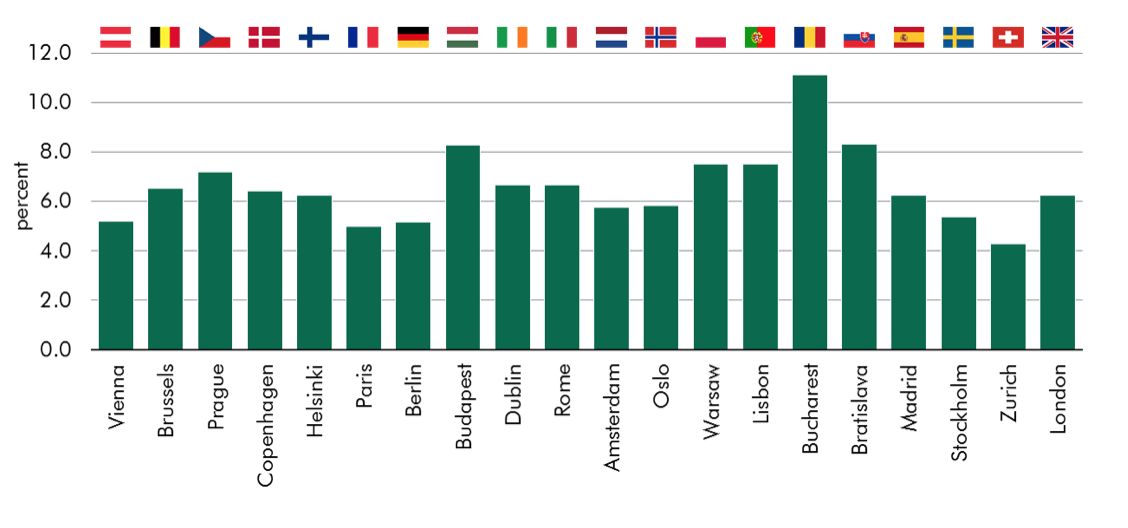
Source: CBRE. Calculated as property yield multiplied by 1/LTV.
A pure Debt Yield may not be enough to properly judge relative risk however, given that some markets’ yields are currently higher than others – a 6% Debt Yield means very different things to markets where underlying yields are 4% and 8% – and given that over the medium and long term different markets will have different average or equilibrium yields – meaning that the probability of a market returning to a property yield of say 6% will not necessarily be the same across markets. Figure 4 therefore shows the gap between Debt Yield and three property yield measures – current yield, medium term average yield (10 years) and long term average yield (20 years, where available). Comparing the Debt Yield to more than one property yield figure enables a more complete view of the risk of capital loss. Doing so reveals that in certain markets lenders are perhaps exposing themselves to more risk than is generally being talked about in the market.
- There are two cities – Berlin and Vienna – where the current Debt Yield is within 50bps of the medium and long term average property yield. In these markets, yield need only move to slightly above average levels for lenders to be at risk of capital loss.
- In a further ten cities – including Paris, Amsterdam and Madrid – the current Debt Yield is within 100bps of the medium and long term average yield.
- The city with most cushion between the Debt Yield and historic average property yields, and thus arguably most insulated against a rise in property yields, is London. Here, current Debt Yields are 213bps and 165bps above the medium and long term average property yield respectively.
Figure 4 Debt Yield on senior debt, prime capital city offices, Q4 2017 versus current, medium term and long term property yield
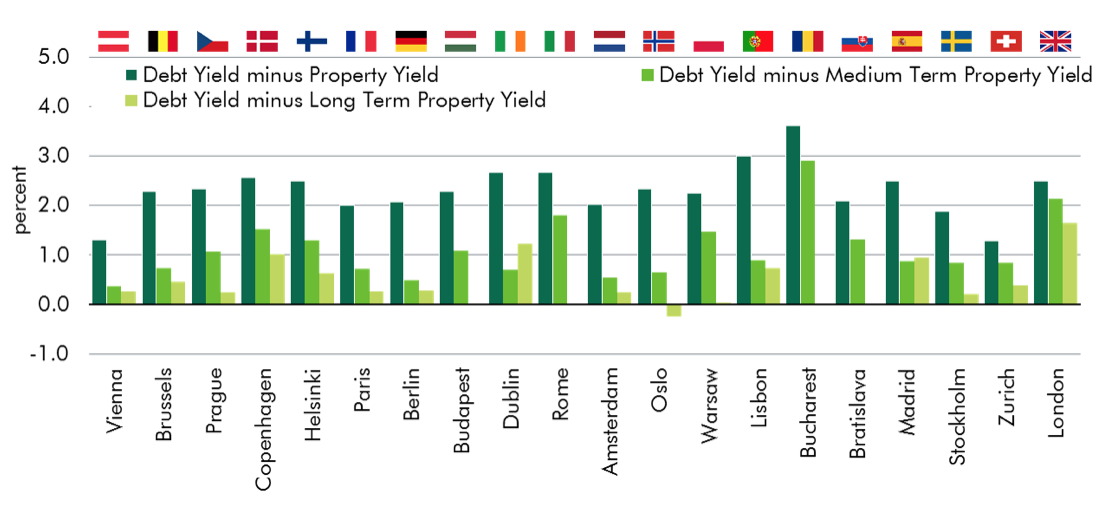
Source: CBRE.
Having looked separately at return and risk, we can now combine our analysis to produce a composite picture, as in Figure 5 which plots risk (as measured by ICR and Debt Yield versus medium term property yield) against return. A lender with a blank sheet of paper might well use such a framework to decide where to allocate capital, while one with an existing portfolio might have regard to it when deciding where to increase or decrease exposure. It should be noted that this analysis does not include “softer” variables such as relative legal or regulatory benefits, nor indeed things like liquidity and scale which may be estimable – it is therefore best to compare cities in smaller groups, on as like-for-like a basis as possible, rather than as a set of 20.
- Of the group four cities in G7 countries, we observe that Rome and London offer lenders higher returns, at lower risk, than Paris and Germany. Lenders might therefore be rewarded by being overweight in the former and neutral to underweight in the latter.
- The Scandinavian cities offer a fairly linear trade-off between risk and return: the brave will favour Oslo and Stockholm, the cautious Copenhagen and Helsinki.
- Among the cities in other Western European markets, similar returns for lower risk arguably make Brussels and Lisbon slightly preferable to Madrid, Amsterdam and Zurich, which in turn are more appealing than Dublin and Vienna.
- The five CEE cities are split into a group of three offering high returns, with risk below average in Bucharest but above average in Warsaw and Prague, and two offering good returns at below average risk, in Bratislava and Budapest.
Figure 5 Comparing risk and return on senior debt, prime capital city offices, Q4 2017
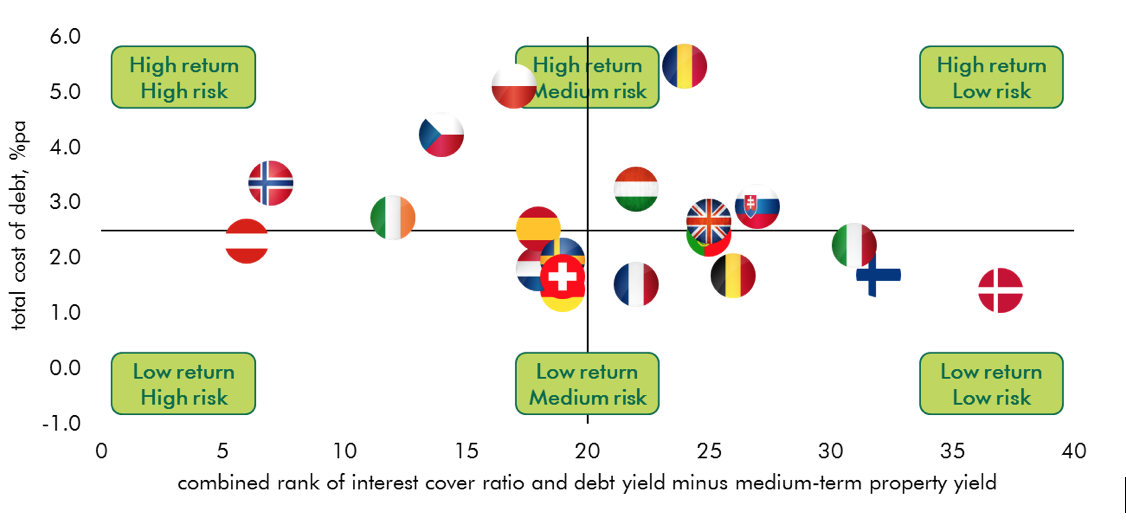
Source: CBRE. Risk on the x-axis is calculated by ranking each city (1-20) on two measures (Interest Cover ratio and Debt Yield minus medium-term property yield), and summing the ranks, so that a score of 1-40 is possible, with a low number indicating high risk and a high number low risk. Return on the y-axis is the total cost of debt (as per Figure 1).
Photo credit: Photo by slon_dot_pics from Pexels


