


High inflation rates have been making headlines since the beginning of the year. Inflation seems to have caught even investors by surprise. While I’m optimistic that inflation will fall over the next year, this belief is formed with the expectation that the stance of monetary policy should and will remain tight. The effective Federal funds rate is currently 0.83% after spending nearly two years under 0.1%. The logic behind the increases in the Federal funds rate, driven by simultaneous increases in the rate paid on reserves held at the Fed, is that higher interest rates indicate tighter monetary policy. This is an age-old wisdom inherited most plainly from Paul Volcker’s tenure at the Fed.
But monetary policy no longer works the way it did under Volcker and Greenspan. In the Volcker-Greenspan era, when the Federal Reserve raised the Federal funds rate, the Federal Open Market Committee (FOMC) would slow the rate of expansion of currency circulating in the financial system by slowing its purchases of US Treasuries. The slowing of monetary expansion translated to an increase in interest rates. As financial activity would begin to falter in response to higher rates, the FOMC would reverse course, lowering the Federal fund target and increasing the rate of expansion of currency.
Since the Volcker-Greenspan era, it has become common to interpret the stance of monetary policy by the level of interest rates. This age-old wisdom, however, is misapplied. It fails to account for the disconnect between interest rates and the quantity of money allowed to circulate in the economy. The FOMC no longer needs to support the Federal funds rate target by changing the rate of expansion of circulating currency. The old mechanism used by Volcker and Greenspan still operates. It’s just not as important. Instead, the Federal Reserve simply changes the rate it pays on deposits. Currently the rate paid on reserve balances is 10 basis points (0.10 percentage points) below the upper limit of the Federal funds target range. When member banks choose where to invest funds, the rate paid on reserves held at the Fed represents a zero-risk option. Competing investment opportunities must offer a higher rate of return to offset risk of investment in the market. By its payment of interest on reserves, the FOMC sets the base of the yield curve.
This, of course, requires that the Federal Reserve is able to manage interest payments. At low interest rates, this isn’t a major problem. The Federal Reserve currently holds $3.315tr in deposits. At the current interest rate of 0.9%, this means that it must pay out $30bn in interest each year to maintain this balance. The Fed currently borrows $2.26tr from the overnight lending market. With the effective Federal funds rate at 0.83%t, this amounts to $19bn in interest payments over the year. This borrowing from the overnight lending market puts upward pressure on the Federal funds rate, but apparently not enough for the rate to rise above the floor set by the rate paid on reserves held at the Fed.
At current rates, the Federal Reserve must pay out $49bn in interest each year to maintain the current level of deposits and loans from the overnight lending market that enable it to borrow these funds. In 2021, the Federal Reserve earned $122.4bn in revenue, which is obviously more than enough to offset these costs. And as interest rates rise, newly purchased financial instruments will also yield higher rates of interest. At present, 31% of the Fed’s purchases of US Treasuries mature within 2.25 years (this excludes Treasury Inflation-Protected Securities, or TIPS, held by the Fed). These securities must be replaced as they mature. We can expect, then, that as interest rates rise, so too will revenues earned by the Federal Reserve as it rolls over maturing investments.
In the past few weeks, the Federal Reserve has modestly begun to reduce its balance sheet. As rising rates increase interest payments by the Federal Reserve, a reduction of the level of deposits held at the Federal Reserve will help reduce the burden of these payments. As long as the Fed’s revenues exceed its expenditures, it can continue to set the Federal funds target without relying on expansion of circulating currency through traditional open-market purchases.
Interest rates and the implementation of monetary policy
It is unclear that policymakers truly understand the cause of inflation. Federal Reserve Chairman Jerome Powell admitted in June 2021 that inflationary “effects have been larger than we expected and may turn out to be more persistent than we expected”. Treasury Secretary Janet Yellen similarly admitted to Wolf Blitzer that she “was wrong then about the path that inflation would take”. In other words, it appears that policymakers do not understand the full extent of the impact of their policies.
The recent jump in inflation is the consequence of a massive increase in the quantity of circulating currency. The high rate of expansion has moderated, with the quantity of circulating currency increasing by less than 5% in the past year. This is a bit less than the rate of expansion that preceded the advent of Covid-19. It is not clear, on the other hand, that balance sheet expansion absent an expansion of circulating currency positively impacts the level of expenditures in the economy. The balance sheet expanded during the decade following the 2008 Financial Crisis. This expansion failed to generate high rates of inflation. In fact, inflation measured by core CPI was less than 2% on average during the decade following the 2008 Financial Crisis. In that time, the balance sheet increased from around $900bn to $4.5tn.
If this kind of expansion is not itself inflationary, why should we expect that balance sheet reduction indicates tightening that will diminish inflationary pressure? The size of the balance sheet does not seem to influence the total level of spending. Expenditures are dependent upon the availability of currency to serve as reserves within the financial system rather than being held at the Fed.
The large balance sheet does impact relative interest rates. In particular, the rates of US Treasuries and of mortgages declined in response to major purchases of these asset classes by the Federal Reserve. Together, these assets comprise nearly $8.5tn of all assets held by the Fed. By holding these assets, the Federal Reserve channels liquidity toward the Federal government and the real estate sector. Rates on these instruments fall relative to rates on other instruments. Since short-term US Treasuries are investments comparable to investment in the overnight lending market, the lifting of the Federal funds rate is consistent with a balance sheet reduction that will tend to raise rates on US Treasuries relative to other rates in the market. However, this channel does not appear to influence inflation. Luckily, the slowing rate of expansion of circulating currency suggests that tightening will be effective in lowering inflation.
Inflation expectations and interest rates
In the past year, interest rates on short-term debt have begun to reflect rising inflation expectations. The interest rate charged on 2-year US Treasuries was less than 0.3% as recently as October 2021. A year ago, the interest rate on the 2-year US Treasuries hovered around 0.15%. Yet, by April 2022, this interest rate reached 2.7%. This is a seismic shift in short-run inflation expectations. The rate on the 2-year hasn’t been this high since 2018, when the Federal funds rate was above 2%. The rate on the 1-year US Treasury is not far behind, having risen from under 0.1% in October to over 2% since April.
This rise in interest rates has motivated the shift toward tightening at the Fed. Interest rates reflect expectations about returns to investment. Part of the return is due to genuine economic growth (we call this real growth). Part is due to expectations about inflation. The rise in the short-term rates has signaled to the Fed that short-term inflation expectations are rising alongside higher inflation readings.
Since October, the market has been catching up with the reality of inflation. The 5-year breakeven inflation rate was hovering around 2.5% in September 2022 and reached a high of 3.59% at the end of March. Investors seem to have been skeptical of the Fed’s willingness and ability to lift inflation. The realisation of higher inflation rates succeeded in undoing this skepticism. The 5-year breakeven rate has since fallen, currently hovering around 3% as investors seem to be persuaded by the willingness of the Federal Reserve to tighten policy.
Many investors seem to trust the Fed to manage the situation now that it has taken a more aggressive stance. Inflation is higher than it has been for four decades, but it is not clear that this high rate will persist. The most recent monthly readings of inflation have provided investors hope that inflation might have reached a high point.
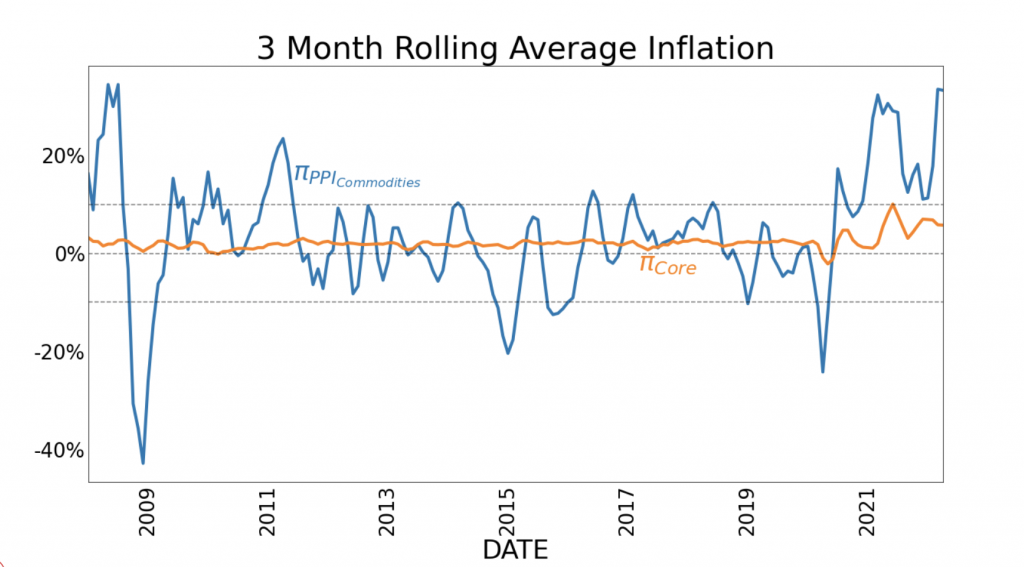
Short-term readings of inflation can be quite volatile and, therefore, difficult to gauge. The annualised rate of core inflation in March was 3.95%, the lowest reading since September 2021, when it was 3.10%. The following month, however, generated an annualised rate of 7.05%. One way of reducing this volatility is to observe the inflation over the course of the previous year. While this tends to stabilise the inflation reading, the long span of time prevents the reading from indicating the present state of inflation.
To generate stable readings of inflation, I have taken the three-month rolling average of inflation. We can see that core inflation seems to be moderating in recent months. It is still too early to tell for sure, but if estimates of inflation in May and June stabilise at or under 6%, investors will likely interpret this as meaning that inflation has begun to stabilise and, hopefully, will diminish. Again, the recent downward moderation of the 5-year breakeven rate suggests that investors are still optimistic about the Fed’s ability to control inflation.
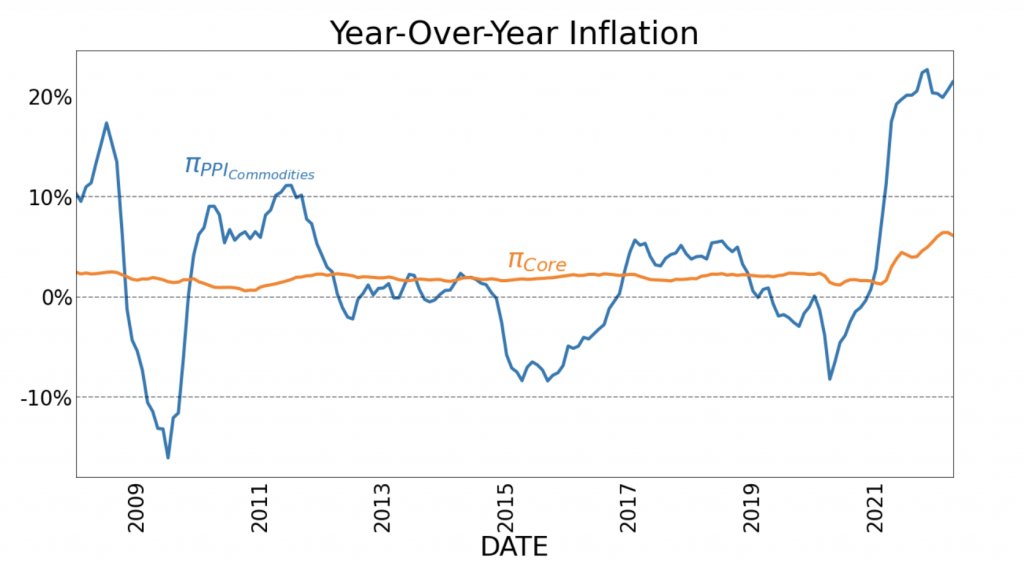
However, not all markets reflect that investors are convinced about the ability and willingness of the Federal Reserve to swiftly reduce inflation. The Producer Price Index’s measure of year-over-year commodity price inflation has remained elevated over the last year. Commodity prices tend to be more volatile than more general measures of the price level. Persistently high readings of the index suggest that investors are purchasing commodities to hedge for inflation. While this is an indicator that deserves our attention, it is not a perfect predictor of the future. In 2008, investors were hedging for inflation when many believed that monetary policy had been too easy for too long. This jump in commodity price inflation, and similar jumps over the last decade have been followed by periods where this inflation measure was low or even moved into negative territory. If tightening by the FOMC is effective, we will likely see a continuation of this pattern.
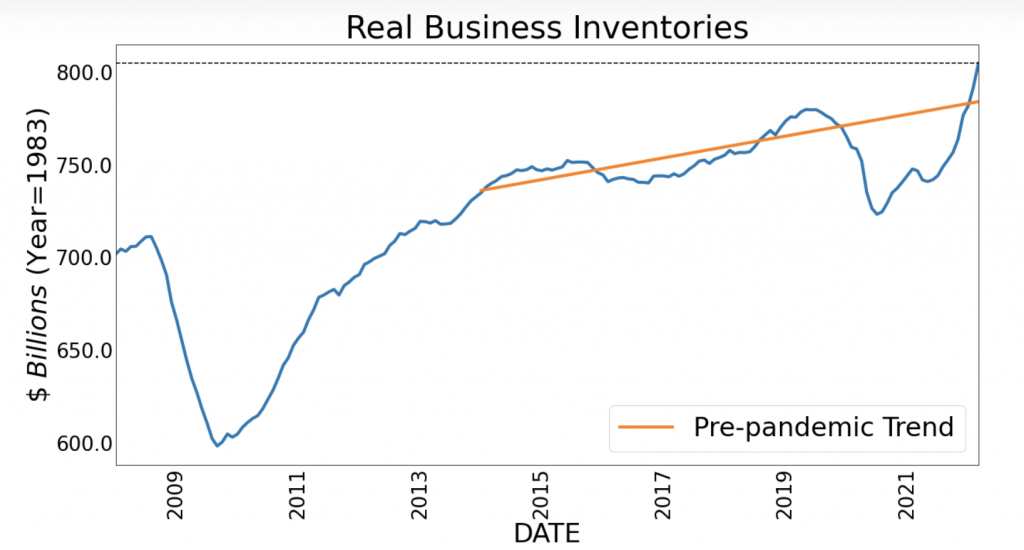
Finally, one measure of the relative intensity of demand is the level of business inventories. In the graph above I have adjusted the value of inventories to changes in the price level measured by core CPI. Inventories have recovered to well above pre-pandemic levels and are well above trend, defined by levels between 2014 and 2019. Having accumulated a significant level of inventories, it is likely that the rush for inventory accumulation has played a significant role in driving higher levels of inflation. This accumulation, of course, has been supported by currency expansion. But it is difficult to imagine that, absent similar expansion, these increases in inventories will continue for more than a few months before either stabilising or reversing.
Summing up
The opaqueness of monetary policy slowed the response of inflation expectations to the monetary expansion that began two years ago. The Federal Reserve has shown that it is able to raise inflation. By Powell’s own admission, policy was too successful in lifting inflation. Yet, investors have maintained faith in the ability of monetary policy to also reduce inflation. The shift in the stance of monetary policy and the response of inflation expectations suggest that we are reaching a cyclical peak in inflation.
The Fed’s move toward tighter monetary policy can be observed by several measures. The balance sheet has stopped expanding and has begun to contract. The federal funds rate target is rising and will continue to rise at least through the end of the year. Further, inflation expectations as measured by the five-year breakeven rate have receded since April. Finally, and most importantly, the expansion of circulating currency has diminished to rates comparable to pre-pandemic lows. These factors and the current state of business inventories suggest that inflationary pressures are likely near their limit.
Originally published by The American Institute for Economic Research and reprinted here with permission.


