This article was originally published in autumn 2019.
Of course they’re inherently illogical, but let’s unpack what they mean in practice for the wider investment market.
How many economists does it take to screw in a lightbulb? Twenty-three: one to screw it in, and 22 to hold everything else constant. It’s quite a dry joke, but I like it. Holding everything else constant: that’s the impossibility of economics, like trying to study the movements of a single fish in the ocean in isolation to the rest of the shoal or the ocean itself.
One thing has long puzzled me in this world: interest rates and their effect on the rest of the world around us. I’ve pondered everything from the relationship between interest rates and life expectancy (negatively correlated) to interest rates and market volatility (not quite sure yet!). At the moment one thing I find perplexing is the idea of a negative interest rate and what that means for the rest of the market.
An interest rate, in my view, is a rate of return that the borrower pays to the lender, in agreement between the two. The rate itself is set largely by the lender’s estimated chance of not getting their money back. For
The same works for countries: Loan to a country with high political and economic risk –19.75% (Turkey). Loan to a country with lots of oil that has never defaulted – 1% (Norway).
The risk-free rate
In order to make the maths work, for many financial calculations the concept of a ‘risk-free rate’ was created. And to keep those calculations spinning it has largely been decided that this is the three-month interest rate on the debt of the country of interest, if that country is highly rated – or, if considered globally, often the US three-month treasury bill is favoured.
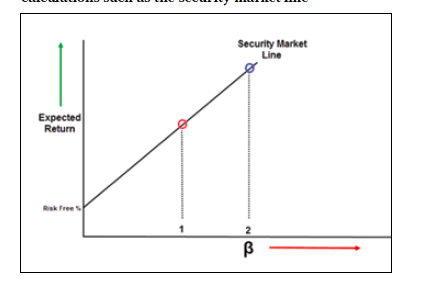
The risk-free rate is the absolute minimum rate of interest that is required from investors just to take the action of making an investment. Anything else in the market should have a higher return than that, based on its level of risk. This risk-free rate supports concepts and calculations such as the security market line, CAPM model, Black-Scholes-Merton and all kinds of other calculations.
Realistically, there is no such thing as a risk-free rate – nothing lasts forever and just because you’re only lending money for three months and it is to a government doesn’t mean that you’ll certainly get it back – but a lot of other bits of financial mathematics fall apart without it, so it is commonly accepted.
Figure 1: The risk-free rate supports concepts and calculations such as the security market line
Central banks and treasury departments
One other thing to consider before we get started is central banks and treasury departments. For most countries, the two are separate. The treasury is the finance arm of government, which receives loans and claims taxes to fund government functions. The central bank, on the other hand, holds deposits and is responsible for creating and contracting money supply and setting interest rates. There is usually very little difference between the rates set by the central bank and those of government debt, otherwise it would imply that people trusted one organisation more than the other.
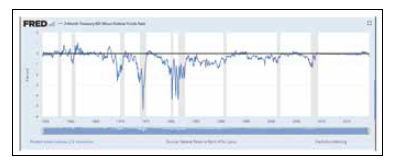
You can see in figure 2 the history of the difference between the US three-month treasury bill (treasury/government) and the US federal funds rate (central bank). There are definitely situations where a big gap can be seen between them, usually negative, meaning that the interest rate offered by the central bank was higher than that of the US government – implying that people trusted the government more than the central bank, which makes sense as the government could in theory change the law, march in some troops and shut down the bank, but not so much the other way around (a central-bank-led coup d’état would be a first). However, doing so would send a pretty shocking signal to the market and bond prices would probably collapse.
Figure 2: The gap between the three-month treasury bill and the federal funds rate
Prior to central banking, interest rates were set by the market. Individuals would judge the risk of the bank they were depositing (lending) their money with and decide if the interest rate they were receiving was appropriate. If you thought the bank wasn’t so great, then you’d want a higher interest rate for depositing your money there, as there was a higher risk that you might not get it back. Central banks were created at different points in history in different countries, for different motives – some rather questionable.
For instance, the first central bank of France was created by Napoleon (who also made himself and his family shareholders) to help rebuild France and support his military campaigns. The Bank of England was established to help fund the ongoing wars with France. The National Bank Act in the US was established by the Union government to fund the Civil War and later replaced by the Federal Reserve Act, which was voted into law on 23 December 1913, after a third of senators had gone home for the holidays.
But whatever the immediate motive for creating them, the central banks brought the benefit that they had the support of the state without being under the control of politicians, which allowed them to act as central counterparties and lenders of last resort.
If in a country the interest rate offered by the central bank is 10%, then pretty much everything else in the economy is going to need to be returning more than 10%, otherwise what’s the point of investing in something that is very likely to have a higher risk of default than the government, just to get a lower rate of return? Similarly, because commercial banks borrow from and deposit with the central bank, loans offered by those banks will have to be at a higher rate than the government’s interest in order for them to have a profit margin.
Negative interest rates
Let’s now talk about this puzzling idea of negative interest rates. At first you might think that negative interest rates wouldn’t have much of an impact beyond simply lowering the overall interest rate in the economy. It just means that the risk-free rate is lower and so the required rate of return on everything else is also lower, therefore it’s cheaper for people and organisations to borrow so they’ll probably do that, and that it’s expensive for banks to store deposits with the central bank so they’ll be more likely to lend instead.
So, what happens with a negative interest rate? A negative interest rate says that anyone borrowing will be paid to borrow, and anyone lending will have to pay to lend. Consequently, in addition to the risk of not getting your money back as a lender, you have the definite certainty of ending up with less money than you started with, even if the borrower does pay you back. This doesn’t make any sense.
Imagine for a second what the world would have to look like for negative interest rates to naturally exist. The perception of risk in any other investment would have to be so high that you think the safest thing you can do with your money is to give it to someone who will charge you to look after it and give it back to you in a few years, minus their fees. This is diamonds in a safety deposit box, cash under the mattress, tins of food and ammunition territory. It implies that there is nothing else out there which can give you a risk-adjusted return above zero. Ouch. The world then becomes an environment of capital preservation, making the least risky choice.
However, this is not what has happened, because the negative rates are not naturally occurring; they have been created by the relationship between central banks and the treasury departments of governments – who ‘recently’ discovered that if no one else was willing to lend them money, they could just print more and lend it to each other at extremely low, or even negative, interest rates. Seems legit.
The theory of low or negative rates is that the low interest rate in conjunction with looser monetary policy (print more money, make credit more easily available) stimulates economic activity and results in real growth, which then allows the central bank to increase interest rates in the future.
But if left for too long, people are pushed towards riskier and riskier assets, not towards safer and safer assets. As a recent paper from the European Central Bank put it: “The current -0.4% negative ECB deposit rate applied to more than €1,900bn in banks’ excess liquidity implies a €7.6bn direct annual cost to those banks that hold the excess liquidity … the direct marginal negative effect of negative interest rates might induce banks to invest in risky projects.” (Excess Liquidity and Bank Lending Risks in the Euro Area, ECB paper, 2018)
Risk/return preferences
What I think is happening as a result of negative rates is a distinct shift in the securities market line, characterised by two different personality types in the market: return maximisers and risk minimisers.
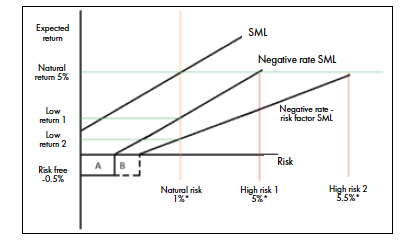
In a ‘normal’ functioning market I believe there is a ‘natural rate of return’ and a ‘natural risk’ level, much like there is considered to be a ‘natural rate of unemployment’. This could be the long-run growth rate of GDP for example, accounting for recessionary periods. This level is marked by the intersection of the orange and green lines in lines in figure 3. The natural return of 5% I’ve borrowed from Thomas Pickety, and the natural risk level I’ve roughly averaged annual default rates data from Standard & Poor’s. The SML (security market line) shows a position where investors should be indifferent to investment choices – they will have a preference for anything above the line (higher expected return relative to risk) and will avoid anything below the line (lower expected return relative to risk).
Figure 3: How changes in the risk-free rate affect investors’ expectations on risk and return
What seems to happen is that people have set expectations of returns and risk built up over time. The expectations of returns are in my view somewhat based on life expectancy.
A 5% interest rate without reinvestment means a payback period of 20 years – a period with a very different meaning to someone in Norway expecting to live to be 82 as to someone in Nigeria expecting to live to 52. The actual interest rates in those countries, to prove a point, are 1% and 13.5% respectively.
Market participants set their expectations of risk and return from the long-run ‘natural’ position. Think of how many people are still unpleasantly surprised to find that annuity payments, savings returns or other pension payments are now much lower than they have been historically and so look for ‘higher’ returns that match their expectations.
As the ‘risk-free’ rate is lowered, the entire SML shifts downwards, which makes certain investments comparatively more attractive, even if they have the same level of risk as they did before when they were not attractive. This is shown by the ‘negative rate SML’ line and the ‘high risk 1’ marker in figure 3.
As more money flows to those riskier assets, chasing returns in order to match expectations, the returns on those assets fall, causing the SML line to pivot downwards, which causes investors to chase ever riskier projects and assets: this is shown by the ‘negative rate – risk factor SML’ line. To maintain the same level of return as was the ‘natural rate’, the investor has to take significantly more risk, as shown by the ‘high risk 2’ marker.
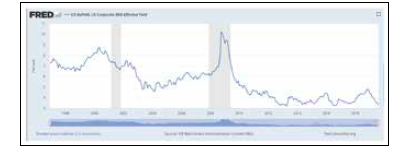
In real estate this is often seen through cycles of development and investment, which start off in the tier-one cities; then as the investment returns dwindle due to crowding, investments into riskier tier-two and tier-three cities begin to occur, where there is often less liquidity and lower quality. And the same change can be seen across markets – from ever-larger investments into the illiquid and complex world of venture capital (see figure 4) to ever-lower yields on BBB-rated bonds (see figure 5). Even if they have the same risk today as they did ten or 20 years ago, competitive demand for anything with a return pushes prices higher and the returns lower.
Figure 4: European venture capital deals
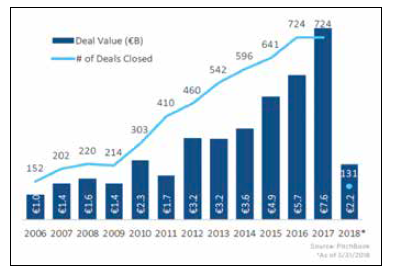
Figure 5: US corporate BBB effective yield
The risk minimisers
Looking again at figure 3, there is the question of what happens to risk-averse profiles, or low-return assets in the presence of a negative risk-free rate. Theoretically we know that all investors should be running away from the negative interest rate and out into the market. However, this doesn’t stack up with what is actually happening on central bank balance sheets, particularly in Europe and Japan.
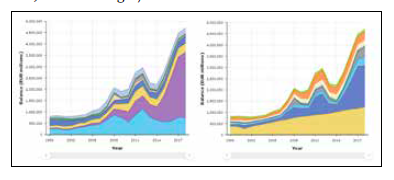
Organisations and banks are still piling money and assets into the custody of the European Central Bank, even if it costs them to do it. Figure 6 shows the ECB’s balance sheet (assets in the left-hand chart, liabilities in the right-hand one). Bear in mind that for a bank, assets and liabilities are the reverse of what they are for corporates: a loan for a bank is an asset, while a deposit is a liability.
The largest amount of assets (purple section of the left chart) comes from euro-denominated securities. The largest increase in liabilities (blue section of the right chart) comes from euro-area banks.
Figure 6: European Central Bank balance sheet (assets left, liabilities right)
There are some technical reasons why banks and other organisations would want to keep money with the central bank, which are to do with clearing and providing collateral to gain access to reserves. (The capital requirements of Basel regulations also come into play.) However, the cost of doing so, which in the case of German banks accounts for a 23.8% cost on their profits, is significant. Why would any organisation do that, unless they perceived the other investable alternatives not to be worth the risk?
The juxtaposition of banks lending more and more to riskier projects, while at the same time paying to store cash, doesn’t make sense. These are opposite reactions to the same action.
Going back to figure 3: the areas A and B I think represent what has happened to the low-risk/low-return section of the market. This is where banks previously might have invested deposits. In the presence of negative interest rates, banks and other organisations have simply decided that it is not worth the marginal gain in return for the increased risk of losses at the low end of the market, and so have simply decided to ‘take the hit’ and deposit funds with the central bank. Better to have a 100% chance of losing 0.5% than a 1% chance of losing 100%. As other assets inflate in price due to the low rates and looser monetary policy, and returns continue to shrink due to crowding, the amount of money allocated to the ‘take the hit’ bucket increases, as shown by area A expanding to include area B. The losses incurred on those deposits then push the bank to simultaneously deploy more capital into higher risk/return assets to offset those losses, thus pivoting the SML further and further, beyond what is shown in the chart. If correct, this divergence presents a significant challenge to policy makers, central banks and the market overall.
In 2015 the US Federal Reserve started to raise interest rates. Since doing so, the amount of deposits that it holds on behalf of other institutions has declined considerably. At the same time, the stock market has continued to rise, possibly as that money has returned to the market as the rates return to a more natural level. Conversely, in Europe stock markets are roughly in the same position today as they were five years ago, while the deposits held by the ECB have rocketed. This seems counterintuitive until you take into consideration that it is the real perception of risk that is driving decision-making, in spite of the distortion of negative interest rates. The market risks are actually far higher than the interest rates are signalling, and negative rates are causing a split in the continuity of the market between risk-averse and return-maximising capital. While it was not the intention of this investigation to recommend any policies, it seems that Europe might actually be better served by allowing rates to come back towards a more natural level and so encourage risk-averse capital to come back into the market.


