Rising rates, or as Jim Grant says, “Interest rates we can be proud of,” considerably change investment decision calculus. Regardless of whether the subject is equity, fixed income, or private investment opportunities, investments can be evaluated using the basic bond math inputs: Yield, Credit, Duration, and Convexity. Yield is what you will get paid, credit is if you will get paid, duration is when you will get paid, and convexity considers “how” you might get paid, either through income or capital appreciation as it relates to changes in interest rates. If this is a bit obtuse, don’t worry; I will focus on yield, the simplest of these inputs, and REIT dividend yields specifically.
Because such a substantial portion of REIT returns comes from income, the going-in cash yield of REITs is an undeniably important consideration for investors. Since 2014, over 70% of the total return of REITs has come from dividends.

Over that period, dividends grew by roughly 3% per year, while payout ratios, as measured against Funds from Operation, stayed relatively flat in the 60-75% range. By these measures, REITs have lived up to their defensive reputation in portfolios, even as the broader market focused on the inflating terminal values of tech companies who eschewed any cash shareholder returns. Today, rising real rates have made money dearer; as a result, cash returns are again coming into vogue.
However, when viewed against the yields available on 10-year US Treasuries, REIT dividend yields are at the widest negative spread in the past decade. On average, the capitalization-weighted REIT index has provided a dividend yield 166 basis points wide of the 10-Year Treasury. Today, that spread is 100 basis points to the negative.
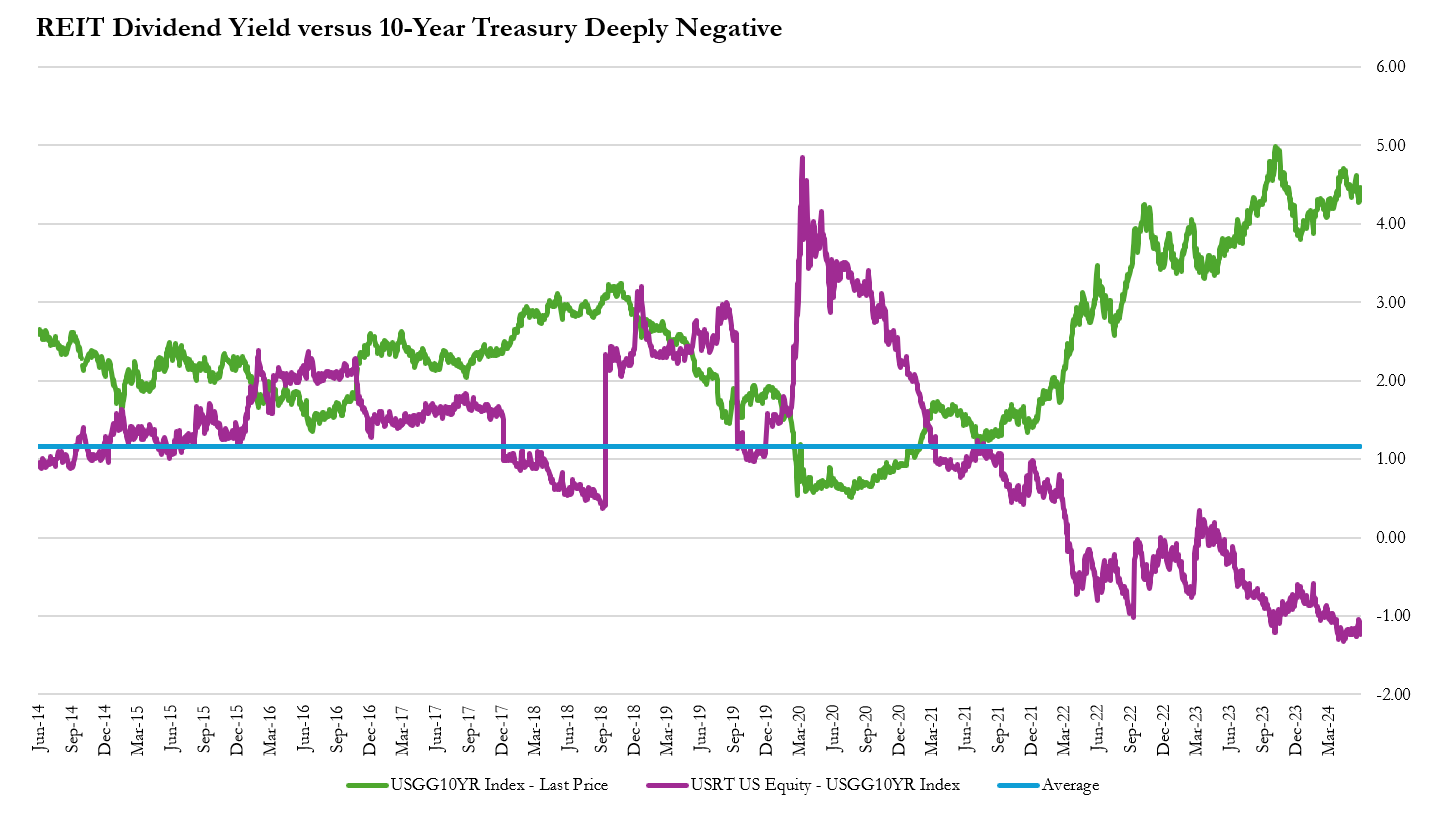
The annualized dividend of IYR 0.00%↑ is 2.24% versus 4.4% available via the safety of the US government benchmark. If shown only this metric, most investors would reasonably assume REITs were overvalued. Surely, an investment whose returns are so reliant on income must offer a higher yield than the risk-free alternative. However, such a view would be overly simplistic when evaluating the overall opportunity in REITs.
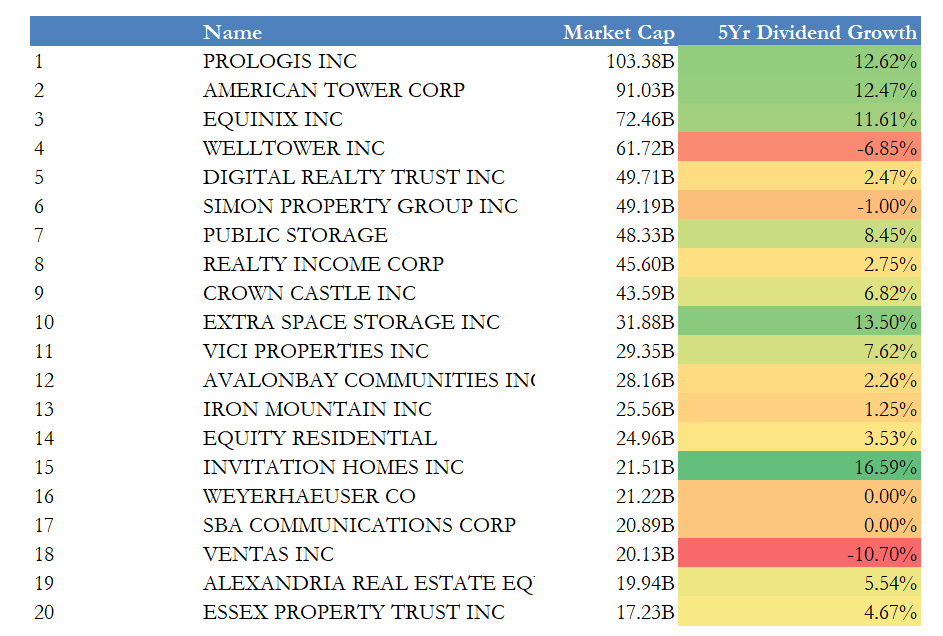
REITs have a mandated return of shareholder capital to maintain their tax status. 90% of taxable REIT income must be distributed. While this taxable income benefits from a sizable depreciation shield, REITs still pay out roughly 70% of their cash flow. That cash flow grows by the levered return on their investments. On a capitalization-weighted basis, REITs have grown dividends by around 5% over the past 5 years, while the top 20 market capitalization REITs have grown their dividends by over 8%.
REIT Market Capitalization & 5-Year Dividend CAGR
To put this into a valuation context, we can use the somewhat simplistic Gordon Growth Model (GGM). The model values equity by looking only at the perpetual value of the dividend and factoring in its long-run growth.

For example, Public Storage PSA 0.00%↑ currently yields a relatively high 4.36% on a per-share price of $275. PSA’s 5-year dividend growth is a bit misleading since they held the dividend flat at $8 per quarter from 2016 to 2023 before raising it by 50% in Q4 of 2023. The simplicity of GGM helps us conceptualize value over a longer time horizon. For our purposes, we will hold PSA’s near-term dividend flat.
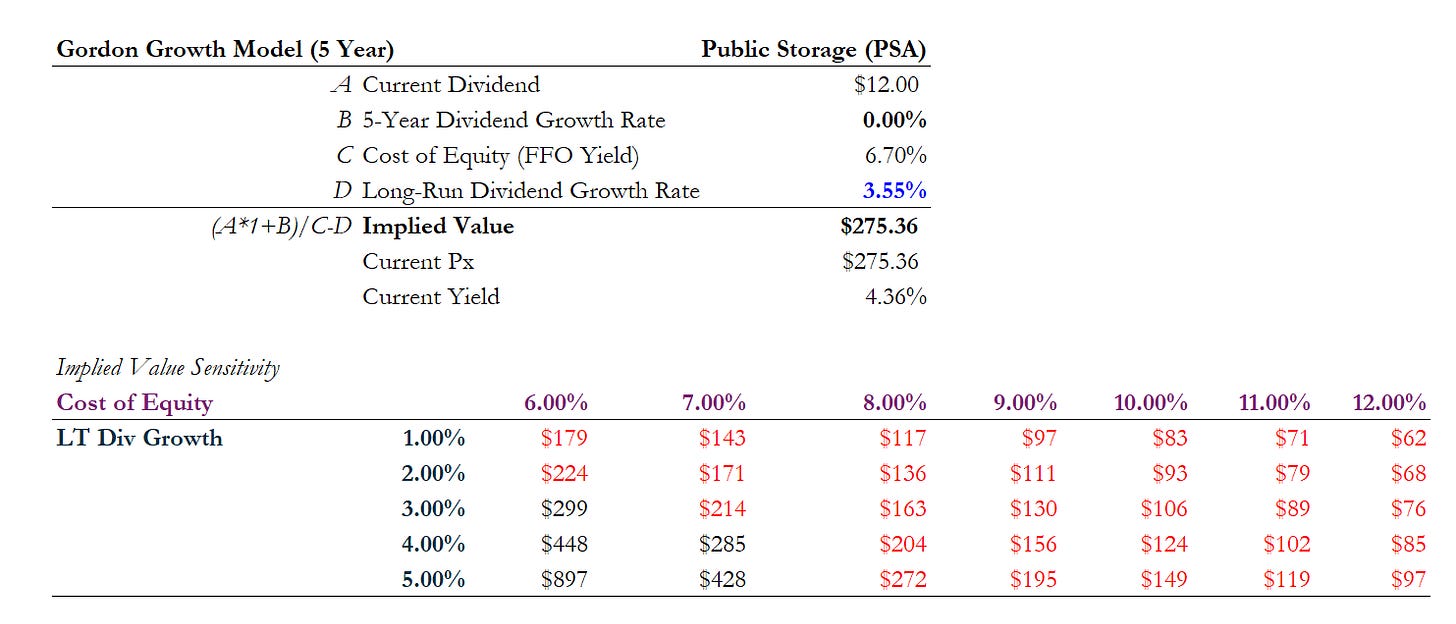
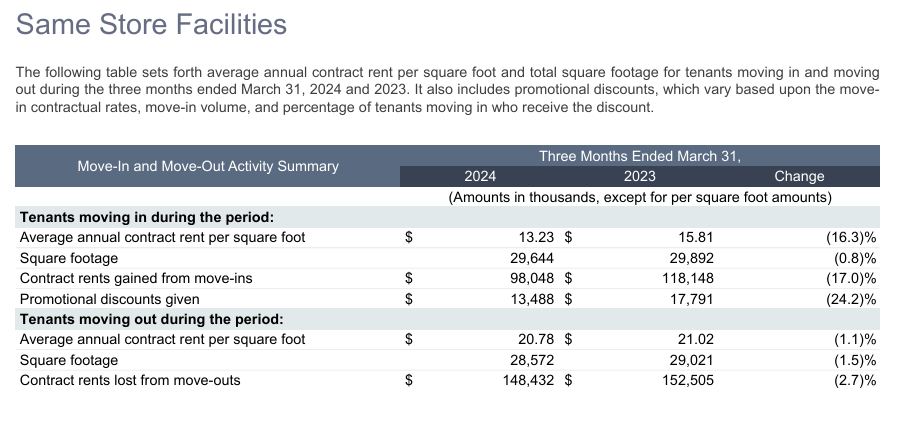
Using PSA’s FFO Yield as a cost-of-equity starting point and assuming long-run dividend growth falls in line with the inflation (~3.50%), the stock looks fully valued on a pure income basis. Public Storage trades below a 5% cap rate, making accretive acquisitions challenging, and like all storage operators, they have pushed rents aggressively in the inflationary environment. This is against a backdrop of ramping supply across markets. Same-store rents are falling, and Q1 FFO declined by 1.2%. It requires a degree of creativity to envision how a behemoth like PSA might meaningfully grow the dividend above inflation.
Obviously, such an analysis is not a basis for an investment decision and does not directly address the overall sector’s negative spread to Treasuries. To answer those questions, you have to invert the above reasoning. REIT yields are not low because investors are expecting flat dividend growth; higher rates have made the cash return more precious, and, in fact, the market is reflecting their expected growth.
Holding treasury yields constant, REITs must increase their dividends by 20% over the next 5 years to return to their 10-year average spread to treasuries. Taking 100 basis points off the 10-year, the required dividend growth drops to 7.40%. Plugging those assumptions into a 5-year GGM, implied long-run REIT dividend growth settles out to ~5.8%. All we have done here is back-solved for the long-run dividend growth rate, assuming a fall in yields and a return to the historical spread.
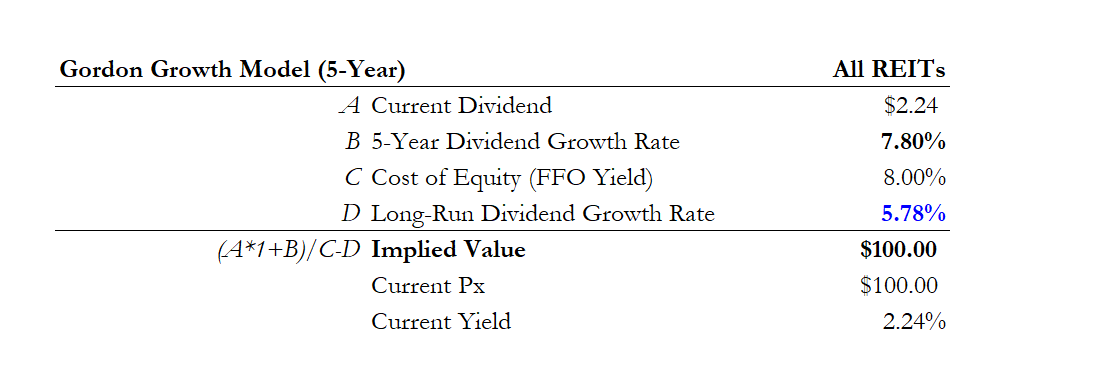
Long-run dividend growth above 5% is a high bar. It assumes not just structurally higher inflation but also that REITs have the pricing power to grow rents above inflation while stabilizing costs. Using these assumptions, it is admittedly hard to argue that REITs are substantially undervalued at the index level. However, focusing on pricing power and reinvestment potential reveals opportunities at the individual security level.
For example, Veris Residential VRE 0.00%↑ is an owner of +7,000 apartment units across New Jersey, New York, and Massachusetts. Veris just recently reinstated a paltry 1.59% dividend yield. That is partially the result of a transition from their life as Mack-Cali, predominantly an owner of office real estate. In 2021, they began liquidating office assets and transitioning to a multifamily focus. The last of those office assets was disposed of in the first quarter of 2024, but they are still working on cleaning up the balance sheet. Full year FFO guidance is $0.50-$0.54 cents per share, the Company’s $0.24 annual dividend equates to just a 45% payout ratio.
What is key to understanding about Veris, especially relative to Sunbelt multifamily, is that incomes are very high relative to rents, and renters face a more dire home affordability market. In Q1 of 2024, the company was able to achieve 7.2% rent growth on renewals and 2% rent growth on new leases.
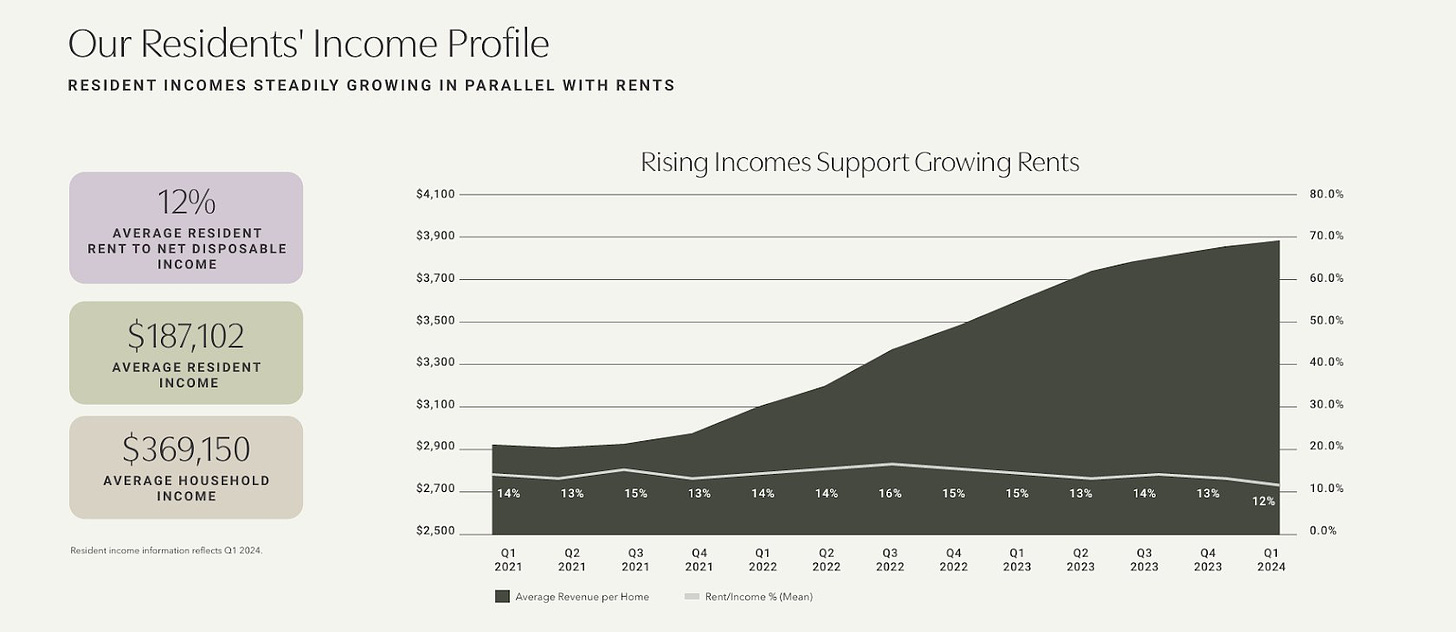
Management is guiding to 2.5%-5.0% NOI growth in 2024. Backing into mid-point 2024 NOI guidance, the current valuation puts the implied cap rate at ~5.5%. The ability to continue to push rents in these markets means that the field of vision for acquisitions is larger than for Sunbelt multifamily, where near-term rent increases are less certain. Veris has both pricing power and a potentially active acquisition environment.
Holding FFO flat but assuming the payout ratio grows to the 70% benchmark over the next five years before falling in line with inflation, Veris looks significantly undervalued.
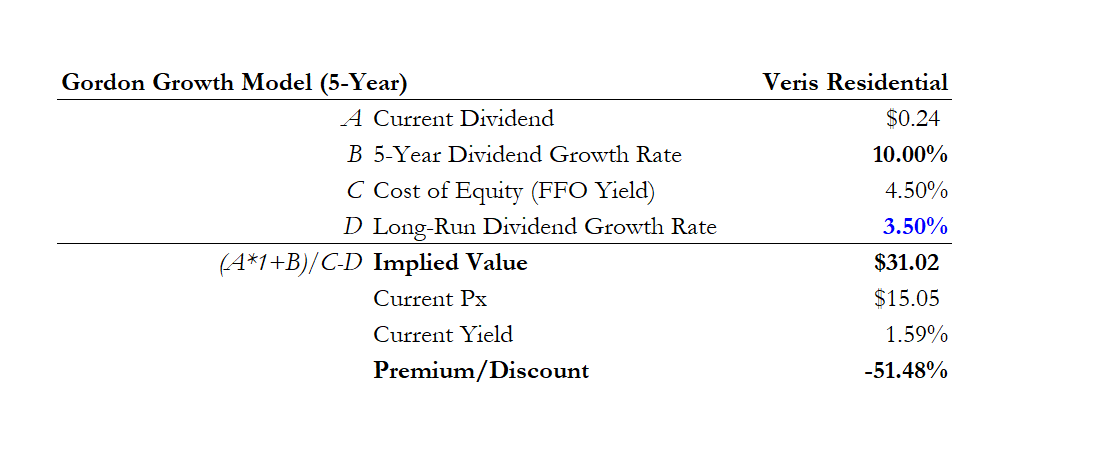
While the Gordon Growth Model is a gross oversimplification, in the vein of Michael Mauboussin’s “Expectations Investing,” it provides an insight into the core underlying assumptions required to make today’s prices “right.” When you compare the dividend outlooks of Public Storage, Veris, and REITs at large, it starts to cast the index-level dividend yield in a new light. The table below summarizes those required assumptions. The REIT index needs both impressive near-term and long-term growth. Public Storage’s current price and yield reflect muted expectations supported by the data, while REITs like Veris have low hurdles to clear and fundamental tailwinds on their way to a full valuation.

Are there more PSAs or VREs in the REIT index? The abuse of cap-weighted indexing means that PSA’s $49 billion market cap relative to Veris’s $1.3 billion market cap certainly skews the blended result. In fact, VRE does not even earn a position in IYR.
The intelligent listed real estate investor will find it useful to gauge dividend yields against property portfolios with better pricing dynamics and longer investment runways. The mind may even drift to well-capitalized office REITs like BXP BXP 0.00%↑ (6.93% dividend yield, 53% payout ratio), who are looking at a landscape of potentially double-digit yielding acquisitions.
Deep discounts to NAV are a woeful approach for REITs compared to high visibility on cash flow growth. Don’t mistake low yields for high implied multiples.
This article was originally published in Lewis Enterprises and is republished here with permission.


