After a
FTSE 100 CAPE ratio review
The FTSE 100 has had a tough time over the last few years, largely thanks to the eurozone crisis of the early 2010s and, since 2016, Brexit. This has kept FTSE 100 valuations relatively low compared to historic norms.
More specifically, the FTSE 100’s CAPE ratio has been below average* since the market crash of 2008/2009.
*The FTSE 100’s average CAPE for the last 30 years is just over 18. However, that period includes the largest bubble in UK stock market history (the dot-com bubble) so I prefer to use the slightly more cautious figure of 16.
In keeping with these generally low valuations, the FTSE 100 entered 2020 at a price of 7,450 and with a CAPE ratio of 15.6, slightly below that average figure of 16.
Soon after that we ran head first into a global pandemic and the stock market reacted exactly as an experienced investor would expect.
Fear and panic led to a record-breaking collapse of share prices, followed by a quick rebound driven by a more pragmatic revaluation of long-term earnings expectations.
At the moment of maximum panic (March 23rd) the FTSE 100 fell below 5,000, a level first reached in August 1997, almost exactly 23 years ago.
When prices decline the CAPE ratio also declines, and with the FTSE 100 at 5,000 in March that gave the large-cap index a CAPE ratio of 10.3.
10.3 is significantly below the average CAPE of 16, suggesting that the FTSE 100 was likely to be very good value at that price.
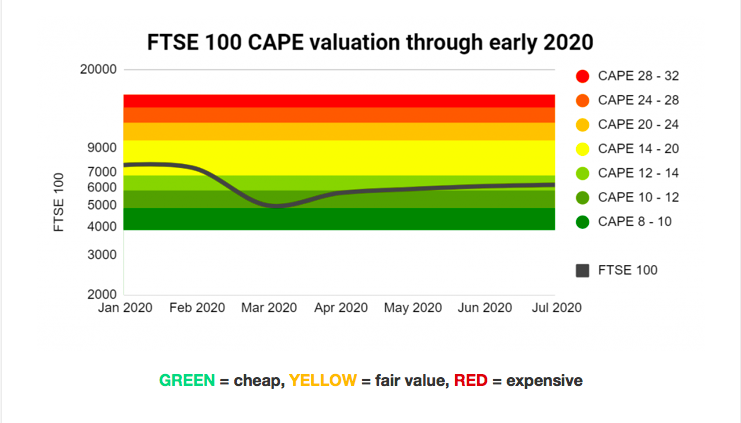
To put that into context, the chart below shows the FTSE 100 against the normal range of possible CAPE valuation levels. It’s a range which extends from half to double the long-term average CAPE of 16.

The March 2020 low of 5,000 is clearly towards the bottom end of that valuation spectrum, implying there was little downside risk and much upside potential, at least from a valuation point of view.
Another way to think about the relationship between CAPE and future returns is to look at earnings yields instead of PE ratios. In other words, invert CAPE to turn it into a cyclically adjusted earnings yield figure, or CAEY:
Cyclically adjusted earnings yield = 1 / CAPE * 100%
March 2020 FTSE 100 CAEY = 1 / 10.3 * 100% = 9.7%
The earnings yield is a bit like the interest rate on a savings account. Of course, earnings can go up and down, but a 9.7% “interest rate” is still a very attractive starting point by historical standards.
Earnings which are not retained by companies are typically paid out as dividends, and in March the FTSE 100 had a dividend yield of 6.6%, more than double its long-term average of around 3%.
So regardless of whether you look at CAPE, cyclically adjusted earnings yield or dividends, one thing stands out:
At the moment of peak fear in March the FTSE 100 seemed to offer very good value.
Since then, the market has rebounded and as I write the FTSE 100 has recovered to 6,280. That’s a return of almost 26% in just four months, which is pretty good going by any reasonable standard.
This should not come as a surprise to value investors. After all, the fundamental principle of value investing is that high valuations (think dot com bubble in 1999) tend to produce low returns and low valuations (the recent panic in March 2020) tend to produce high returns.
Despite much gnashing of teeth over whether value investing still works or not, that fundamental principle has not changed one tiny bit.
At 6,280 today the FTSE 100 has a CAPE ratio of 13, which is slightly below the average of 16. Given that slightly low valuation, I would say this:
The FTSE 100 is probably slightly cheap and is therefore somewhat likely to produce slightly above average total returns (where average is around 8% annualised) over the next five to ten years. If the index rose to “fair value” tomorrow it would grow by 24%.
Article originally published by UK Value Investor


