


- CRE hitting bottom?
- a good time to travel
- some office landlords are doing pretty great
- love that used home smell
- resi markets with a bit of softness
Is commercial real estate hitting bottom?
Random Walk has gathered data on this point (somewhat skeptically), but the evidence continues to mount:
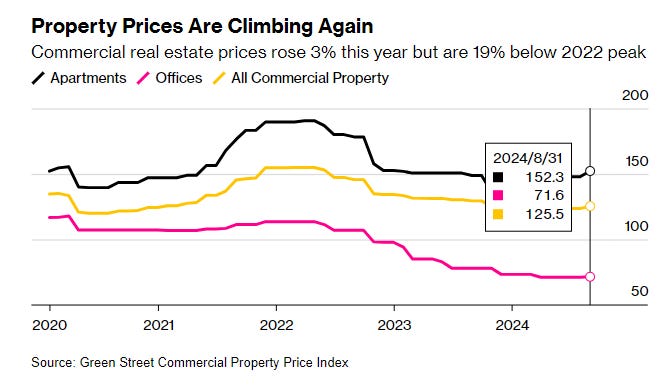
The Green St. Commercial Property Price index is showing improvement for both multifamily and office buildings.
That’s gotta be a sight for sore eyes.
Market commentary (from the brokers, but still) is downright ebullient:
“…there are signs that more bidders are eyeing property and loan sales. Recently, lender Parkview Financial marketed about $300 million of loans tied to apartments and offices in New York, New Jersey, and Connecticut. Each loan received multiple offers and bids averaged about 95% of face value . . . [a]n investor looking to raise $120 million of debt to acquire a portfolio of Florida warehouses received a dozen bids from major banks and insurers, according to Michael Gigliotti, a senior managing director at Jones Lang LaSalle Inc. who’s working on the transaction. Three months ago, that type of deal would have received four to five offers, he said.
“’You’re getting the triple whammy: Players, prices and indices are all cooperating,’ said Gigliotti. ‘It feels like there’s been a switch flipped. Everybody seems excited and we’re calling it the beginning of a new liquidity cycle.'”
A triple whammy! So many whammies!
It’s not just Green St. that’s showing positive signs in pricing.
Trepp’s CRE index is reasonably encouraging, as well, but not quite as encouraging as Green St.
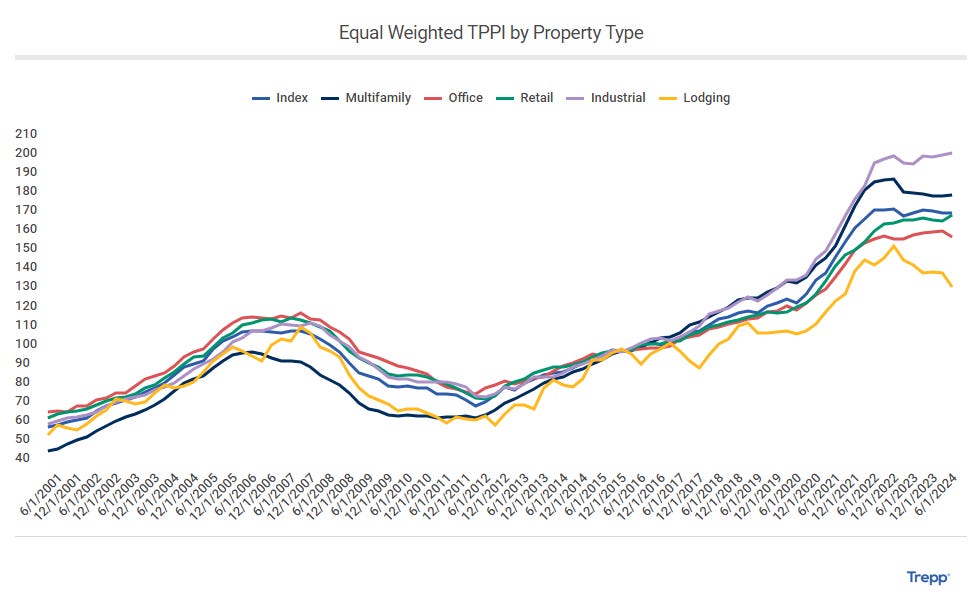
Prices are mostly flat, albeit Industrial is rising (data centers, rawr!) and Lodging is falling. No one really talks about lodging, but it’s been getting hit pretty hard.
Flat is better than falling.
To be fair, Trepp’s index only covers the 1H, so it’s quite possible that the last few months have taken a turn for a better.
Trepp also does some interesting work trying to track the various cost pressures that owners and developers have faced (in addition to rising capital costs).
Rising insurance costs are a big one, because it’s a (mere) double-whammy of labor and capital costs.
Repairs and maintenance too, because again, the higher costs of labor.
This chart, however, I cannot figure:

Baltimore, SF and St. Louis have (apparently) had the highest increase in maintenance costs per square foot.
Assuming the data is sound (and it’s not just a one-off thing), Random Walk has no idea how to interpret this.
Old inventory? Crime? Bad luck? Extreme labor shortage? All of the above?
Idk, I just thought it was odd. Maybe someone will inform me in the comments.
A good time to travel
Back to the not-that-much-maligned lodging.
Part of why the asset prices are going down presumably has something to do with people spending less on lodging.
Revenue Per Available Room or RevPAR—and occupancy—is down across the board (except for Luxury) :
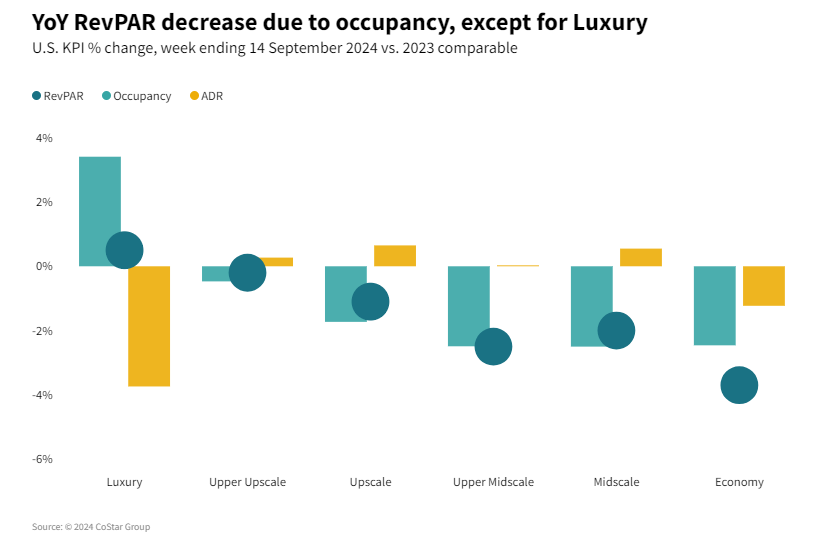
RevPar decreased anywhere from -0.2% all the way to -3.7% yoy.
Luxury proved the exception, where occupancy increased substantially, in all likelihood, because the Average Daily Rate or ADR, decreased by just as much.
In other words, luxury lodging lowered prices and improved occupancy, which netted out to an improved RevPAR.1
Every other class kept ADRs flat or slight higher, and occupancy suffered accordingly. The exception was Economy, which lowered prices and still saw occupancy decline.
Are consumers stressed or cautious? Idk, you tell me.
The other neat and funny thing about lodging is that if you’re planning a trip to Las Vegas, October/November looks like a great time to go:
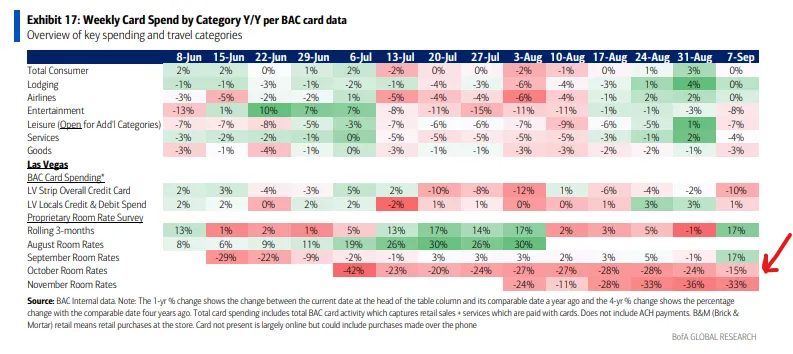
Transaction data for LV room rates in November are down almost a third yoy (and almost a quarter for October).
There’s a lot of seasonality at play here, so I wouldn’t read too much into it, but hey, get your vacation tips at Random Walk.
Some office landlords are doing pretty great
Random Walk has made this observation a few times, but I’ve rarely seen it expressed quite so effectively in a single chart(s):
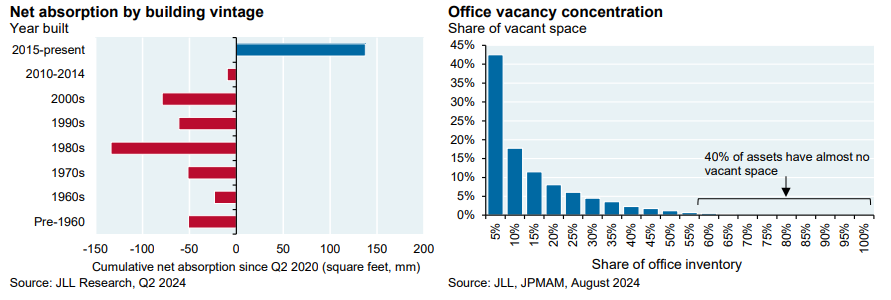
~70% of office vacancy comes from 15% of the inventory.
Pareto effects explain everything, as per usual.
What that means is that office is getting hammered, but the hammering is not equally distributed. If you’ve got a relatively new building—built 2015-present—you’re doing ok. If you don’t, then you’re not.
Speaking of which, I just found this visualization to be kind of fun.
It basically shows where newer buildings comprise a relatively larger share of the overall skyline (as measured by the Top50 tallest buildings in the city).
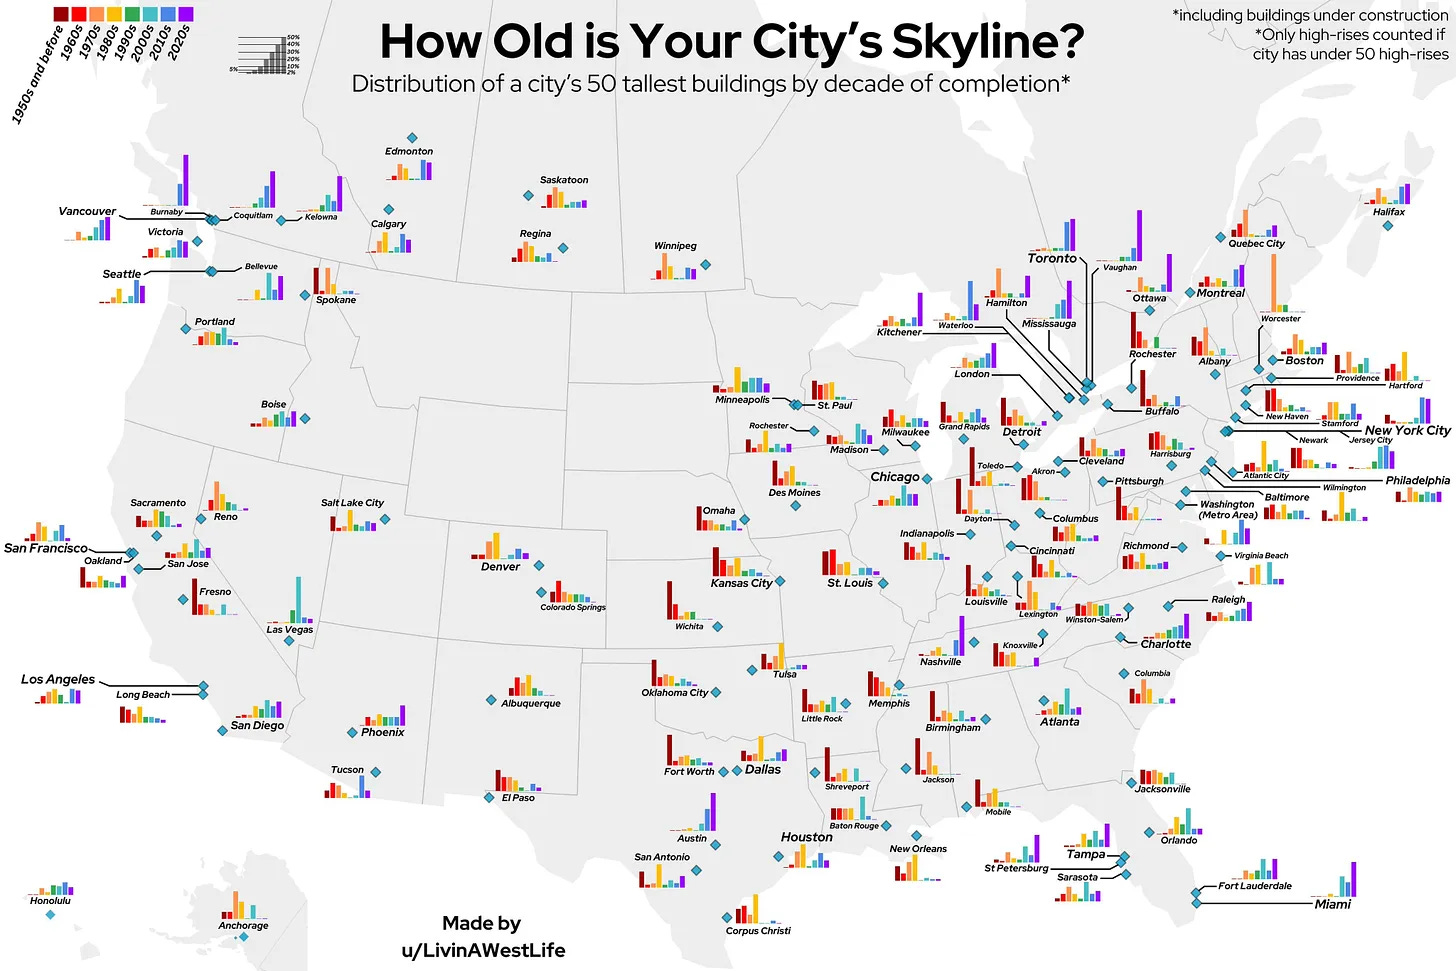
Lots of purple and blue, means lots of recent building, whereas reds and yellows, means there are a lot of older buildings taking up airspace.
Both commercial Canada (Toronto+) and Western Canada must be totally unrecognizable. Just an incredible run of big towers recently.
Also, as per maintenance costs, it turns out that inventory in Baltimore, SF, St. Louis and Jacksonville (and a few other names on that list) is actually pretty old. So maybe that’s it.
One random chart plus another random chart equals enduring wisdom and knowledge. This is the way.
Love that used home smell
Another long-running Random Walk theme: home values are not increasing (and there is no housing shortage).
But the case-shiller index says..!
Ignore the index. No one is selling homes, so the index is just tracking the few exceptions that clear. It is not a good sample of the rest of the market.
If you want to get a sense of where home prices are actually going, then look where homes are actually being sold. That’s the builder market. Homebuilders are in the business of selling homes, and not appreciating home equity, so they don’t have the luxury of waiting things out.
Homebuilders are also very good at what they do, and they will build and price to market.
In this case, that means that they are building smaller, more affordable homes, which is, of course, what you do when your customer’s purchasing power declines:
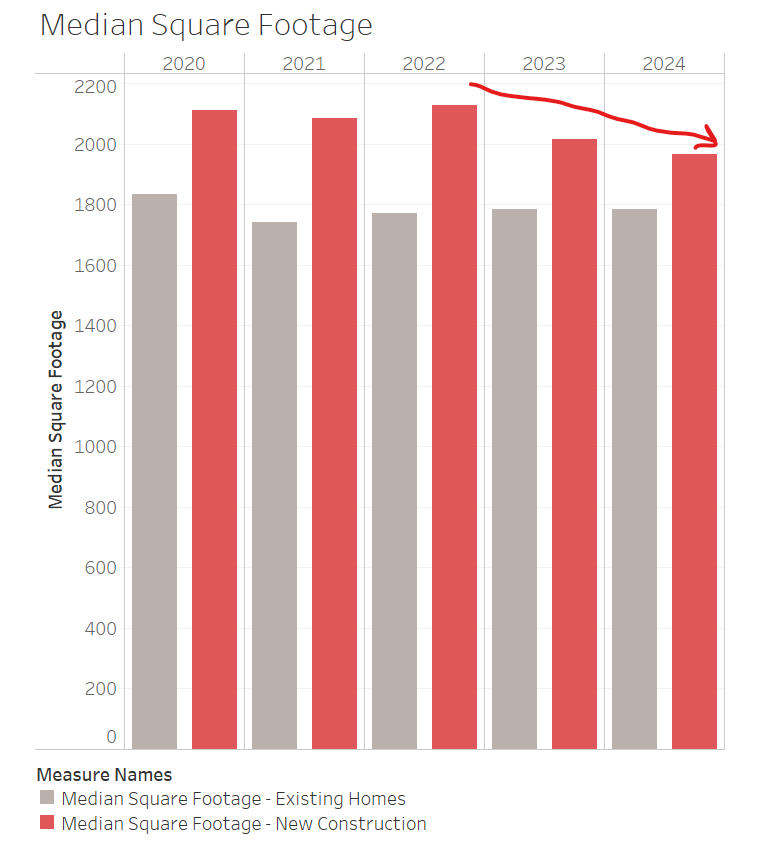
Median Sq. Footage of new construction has declined pretty steadily since rates first moved up.
That builders are building smaller, cheaper homes (often with various concessions and rate buydowns as part of the package) is a pretty good sign that actual home values have come down.
Here’s another way of looking at the same thing.
The “new house premium” (i.e. the price difference between new construction and existing homes) is as low as it’s been since 1984:

Median price of a new home is just 5% more than a used home, or about the same as it was when full lockdowns were in effect and basically no one was buying houses.
So what does it mean? Why would people be so relatively indifferent to having a brand new home?
Either people just love that lived-in feel . . . or the actual value of existing homes would be much lower, if any existing homes were to sell.
(Hint: it’s the latter, for sure).
Not to worry though, as homebuilders are doing just fine. There is demand for the homes they are building. Homeowners are also doing just fine. Absent widespread job loss, homeowners are free to coast on their low-rate mortgages, while their banks suffer the “lock in” effect.
Some markets feeling soft
Are some markets feeling a bit soft?
Yes, of course.
They’re soft relative to some rocketship highs, and there’s probably a bit more new supply relative to demand than builders would like, but there are no alarm bells in the bigger scheme of things.
According to Parcl Labs, these are the markets where supply and demand have both moved substantially in opposite directions:

The “hazard” markets are basically all sunbelt markets, where demand has slowed, but supply is robust.
Unsurprisingly, these markets are also seeing a lot of price cuts:

Tampa, Orlando, and even Miami have seen price cuts on more than 40% of inventory.
Go get that Florida home!
And yet, these are still secularly strong markets with demographics and migration on their side.
There will be some hurt for some investors, but for the most part, it should be generally fine (again, assuming the wheels don’t come off the economy more broadly).
This article was originally published in Random Walk and is republished here with permission.


