In 2009 the GFC, which was responsible for severe asset value losses, resulted in a large funding gap between the debt position and the asset value. As this was essentially negative equity, fund managers were often struggling to attract either highly opportunistic equity or debt.
Only 10 years later, the retail sector is experiencing a very similar situation again. We have focused our analysis on three different sources:
- the 40 largest shopping centres and retail parks in the UK held by the most well-known REIT owners, Intu, Hammerson, New River, Capital & Regional
- Cass CRE lending report, reported debt by lenders secured by retail assets
- IPF The Size and Structure of the UK Property Market year-end 2018 report, total sector size
The most important shopping centre assets represent a total value of assets of £15bn at year-end 2019 generating £1bn NOI (6.9% NY), with the Trafford Centre as the largest (13.6% share of total) followed by Lakeside with a share of 8%. Most REITS have already reported asset value declines during 12 months in 2019 of 2% – 5%. In contrast, share price decline for Intu or Hammerson over 2019 was 85% and 37% respectively, much larger than reported asset value declines. The amount of outstanding debt on £15bn of retail assets held by the sampled REITS is approximately £9.1bn. This includes secured loans and public debt such as debentures and bonds but largely excludes unsecured credit facilities.
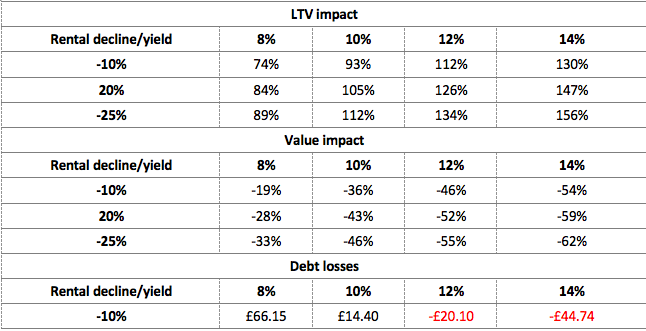
While some assets have higher LTV’s than others, on average this amounts to 61% LTV with most covenant levels commonly set at 60%, 65%, or 70%. The sensitivity analysis shows that, with a further rental decline of just 5% and a constant yield the 65%, LTV covenant is at risk of being breached requiring investors to pay an additional £1bn of equity. However, a decline of 10% in rents and an additional yield shift to 9% for prime assets and lower double digit (12%) for secondary assets is more likely. This could result in a close to 100% LTV situation with a loss of nearly £6bn of additional equity.
Table 1: Sensitivity analysis: rental decline vs yield shift


Any further changes in yields or rental decline would result in negative equity and hence certain enforcement by bank lenders and losses for banks.
As most investors have locked in interest rates of 3% – 3.5% on their current debt, approximately 50% of debt still has ICR’s well over 2x, while another 50% has slightly lower ICR levels of 1.3x – 1.8x. These facilities are likely to experience breaches of ICR covenants already and are more at risk of default in case of further income decline.
Our more severe rental decline scenarios of 20% and 25% show that 12 – 15% of loans would be in interest payment default, and 45 – 50% in total cash sweep, where all cash is used to pay down the outstanding loan amount and/or keep an interest rate reserve. Investors might also be expected to deposit additional cash to cure LTV and ICR breaches.
Since loan pricing for retail assets has also increased over the last 18 months by 100% in some cases, this would increase the need for additional capital to lower the overall debt amounts in order to increase future ICR levels for any new loan financing.
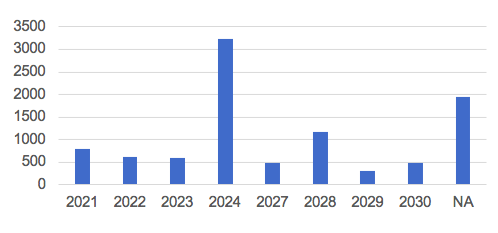
Our analysis further shows that a large amount of the debt is expected to mature in 2024. Overall, the average weighted maturity of the debt is less than 5 years. With an annual turnover of £40-45bn of debt annually, these selected shopping centres and retail parks represent ca. 1.3% – 1.5% in the next 3 years but about 8-10% in 2024. Retail assets overall represented about 15% of outstanding secured debt in 2019 (£25 – 30bn) and 10- 15% of originations.
Figure 1: Debt maturity profile (£m) of selected REITS portfolio

Given the additional economical stress of the current coronavirus crisis we expect further rental declines, for example a 2-months rental loss for retailers results in 17% of rental loss p.a., while a loss of 3-months rents equates to 25% p.a., which makes interest payment defaults more likely to occur. This assumption is in line with landlords now starting to offer rent relief and rental payment holidays. Hence, our extended stress scenario predicts LTV’s of 110 – 140%, which equates to a loss of equity of 54% or £8bn. In relation, share price movements during the Jan – March 2020 reflect an additional loss for Intu of 73%, Westfield plc 53% and Hammerson 46%. Supermarkets show most resistance with share price losses of only 9% for Tesco and 11% by Sainsbury.
The wider retail market perspective
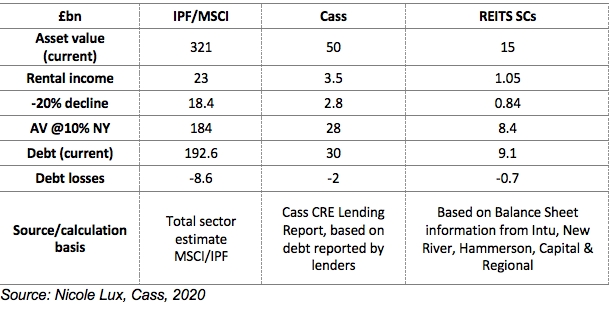
According to the IPF’s “The Size and Structure of the UK Property Market year-end 2018” report, the asset value of total retail held by institutional investors is £321bn (this includes all types of retail from single shops, supermarkets to shopping centres).
Table 2: Invested universe by sector

Assuming a rental shortfall of 20% – 25% and a yield shift by 2-3%, lenders and investors could be facing a funding gap of anything between £8 – £40bn. This analysis further assumes that the average amount of debt for the sector is 60% LTV or £192bn of debt.
Table 3: Scenario analysis for retail sector


However, not all assets have been financed with debt and some types of retail will be more affected than others. As mentioned, supermarkets and retail for other essential goods will be less affected, but the coronavirus crisis does not distinguish between prime or secondary retail. Non-essential consumer goods will suffer across brands and shops regardless of locations. Currently the Cass CRE lending survey reports £30bn debt (reported by 80 lenders), this relates to a total value of the sector of approximately £50bn. Applying a rental decline and increase in yields to this smaller number financed by secured loans, we estimate equity losses of 50-60% and losses for lenders of £8-10bn for the sector.
Table 4: Sector sensitivity analysis

In summary, we have the following sector evidence from different sources. Overall, regardless of the total sector value affected, debt losses are predicted at the level of 5-8% for lenders in each scenario (further detailed analysis in Cass CRE Lending Report).
Table 5: Overview of reported figures, £bn, 2019


