A story of supply and demand?
In a previous article (The Property Chronicle, Autumn 2021, ‘Property Investment: Is it still worth it?’), it was argued that rents are an interaction between what an occupier thinks the space is worth and the minimum amount that a landlord is willing to accept. Ultimately, this is about supply and demand, but sometimes the links between the affordability to the tenant and its impact on demand is not fully articulated. In this article, we look at that relationship in the context of the rapidly changing UK retail environment.
The classic demand and supply framework
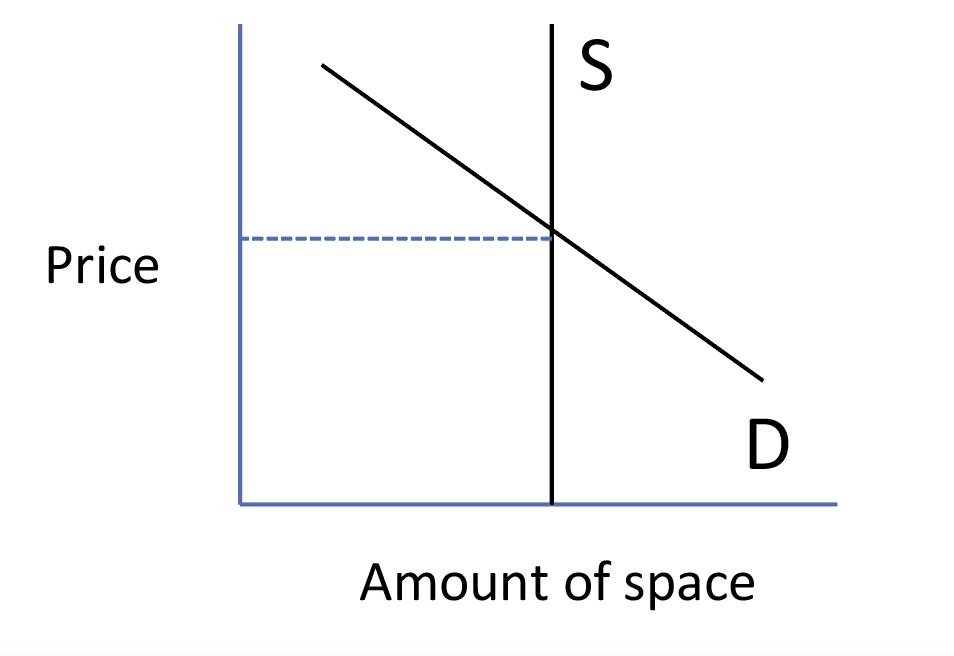
In a classic supply and demand framework, there is a downward sloping demand curve and an upward sloping supply curve. For real estate, supply equates to the existing stock and could be regarded as fixed (vertical) in the short term. Whereas, the demand curve is downward sloping, as the more competition retailers face, the lower their profit and the lower the rent they will pay. Thus, the price will be agreed at the intersection between demand and supply.
Figure 1: supply and demand (real estate)
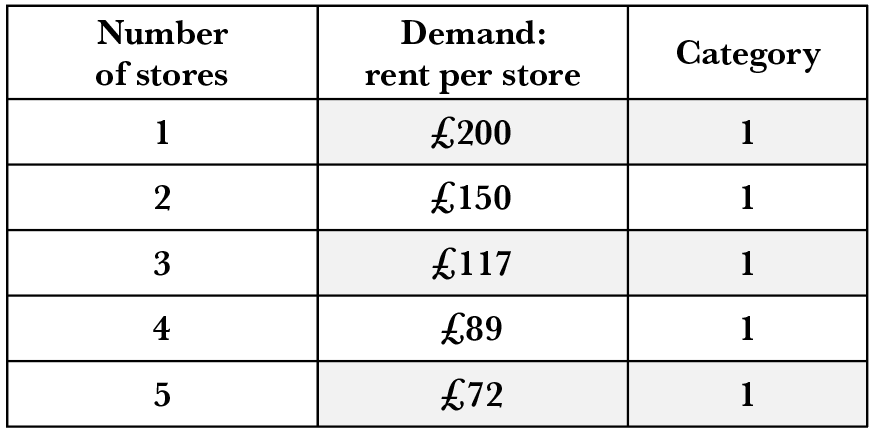
The demand curve assumes that retailers will pay a lower rent the more stores are occupied due to the reduction in turnover as the number of stores increases. In Table 1, the rent per store falls as the number of stores occupied by competing retailers increases.
Table 1: Demand from Retailer of Category 1
In practice, the increase in the number of stores works in two dimensions: the number of stores of the same facia in a catchment and the number of stores of different facias.
For simplicity we will assume that the different retailer categories do not compete with each other (indeed they may be complementary).
Table 2: demand from retailer of category 2
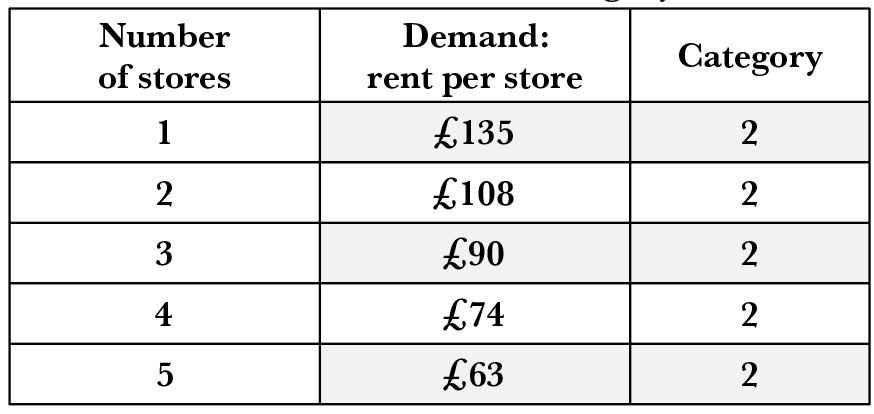
Table 2 illustrates the demand schedule for a second retailer category. The aggregate demand curve leads to a higher rent as shown in Table 3.
Table 3: aggregate demand curve
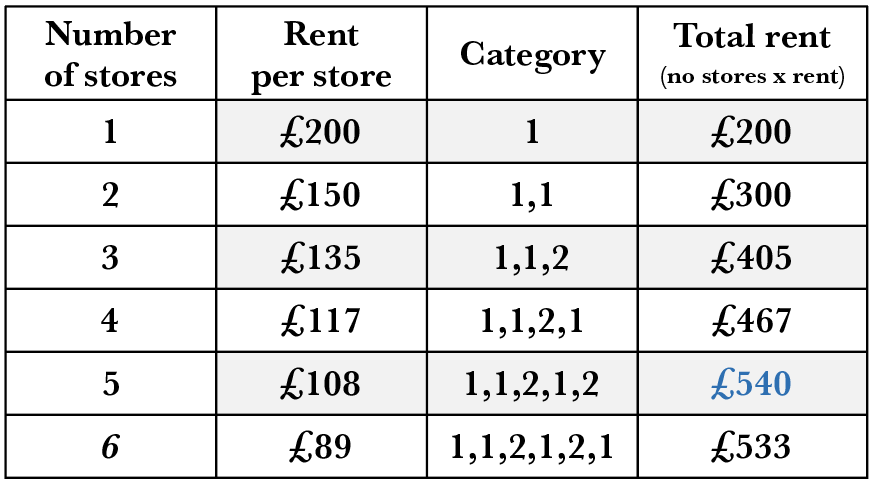
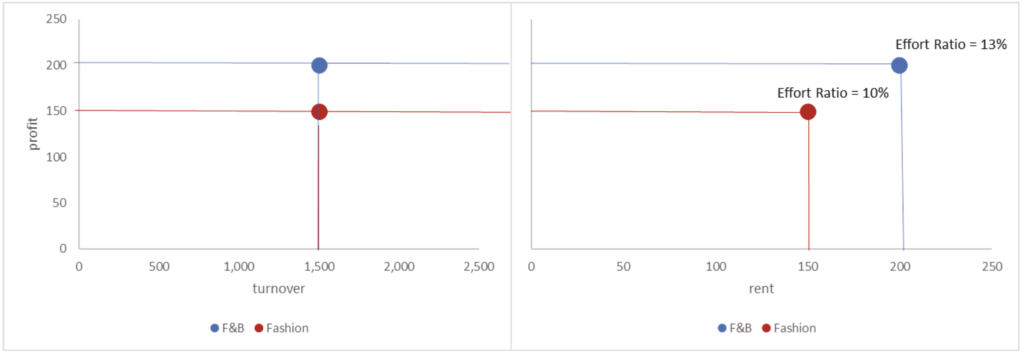
Chart 1: turnover versus profit, profit versus rent and implied effort ratio by retailer category
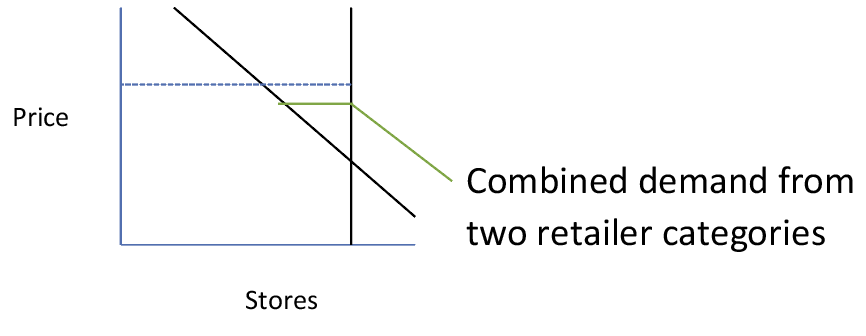
The optimal occupier mix is based on the rent schedules in Tables 1 and 2, with three occupiers of category 1 and two of category 2. As the total rent on five stores is above that on six stores, the landlord withholds one store (keeps vacant). This is assuming that the landlord is happy to have an empty store from a property management viewpoint and that costs of an empty unit are ignored. The demand curve is now ‘kinked’ as shown in Figure 2.
Figure 2: supply and demand (kinked)
Demand and affordability
It is at this point that we should link the demand schedule back to the worth of the space to the retailer as it is based on retailer’s expected profit. Retail categories (fashion, food & beverage, etc) with higher profit margins can therefore afford higher rents for the same turnover. This can be observed by the landlords measuring the rent as a proportion of turnover (known as the ‘effort ratio) as illustrated in chart 1. But with omni-channel retail, a store may have a marketing presence in a location that translates into online sales rather than within the store (often called the ‘halo effect’). The shop has become a ‘shop window’ and this increases the worth of the store to the occupier without the turnover for that store increasing accordingly. The metric for understanding the demand curve has become blurred.
It is possible that the retailer will be prepared to pay a higher rent for a turnover-based rent versus a fixed rent as the risk that the total rent burden becomes higher than the appropriate effort ratio:
in a market downturn, or;
if the individual store/retailer under-performs the market.
In other words, turnover-based rents could logically lead to higher demand and therefore higher occupation/take-up. If there is a move towards stores being let with reference to the effort ratio of the occupier there will be an issue in identifying the market rent (the best rent readily achievable) of each store, as the best rent achievable will depend upon the likely occupier and not the store itself. In other words, the market rent needs to be affordable to the retailer type in that unit and not a blanket market rent for every unit. This will be the case even for a fixed rent lease.
To support this change in approach to estimating market rent, data on retailer turnover and average effort ratios will be required. In an omni-channel world, these effort ratios will reflect both in-store and online sales. In the short term, with vacancy rates at elevated levels, this demand profile will be unobservable to landlords and retailers will underplay the value of halo effects as part of the negotiation process.
So, what is the outcome of all this change in the shopping centre market? First, new letting rents are likely to be set below the intersection of demand and supply as the calculable effort ratios are unable to capture the ‘true’ demand, including the halo effect. But this could be argued to be part of a rebasing of rents and as the market moves back to equilibrium, occupiers will be willing to pay for this external worth. Second, we will see that market rents will start to be set according to the type of occupier and better linked to the declared effort ratio of each occupier. One benefit of this alignment should be that tenant defaults are less likely in the future.


