Visualising is halfway to understanding.

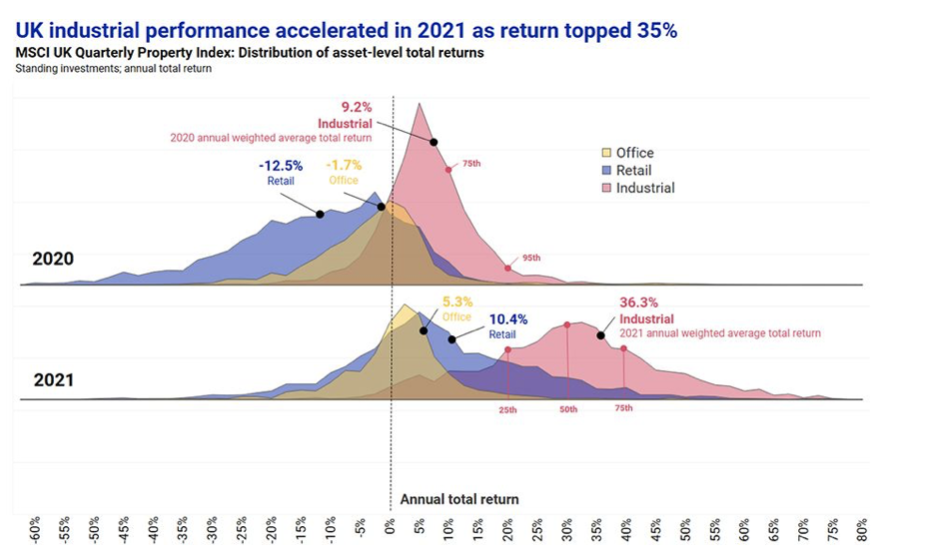
It’s hard to visualise risk, but MSCI produced a mesmerising graphic of the variation in individual UK property returns for 2020 and 2021 split by sector, which neatly differentiates between the market and individual property risks.
The wide divergence in market returns between the retail, office and industrial sectors in the past two years is shown by the sector average arrows. This variation reached a crescendo in 2021, with the sixth consecutive year of superior industrial performance culminating in the widest margin of out-performance yet.
Despite the superiority of industrial sector returns, a proportion of office and retail assets out-performed the lowest returning industrial assets, as visualised by the overlapping distribution of individual property returns in each sector. This illustrates that specific property risks are much greater than market risks in individual years.
The range in individual property returns could have been grouped by factors other than sector, which may have allocated more risk to structural rather than property specific factors. Such additional categorical variables include region, quality and income security, or more detailed property subtypes could have been employed, such as cold storage within industrial or retail warehouses within retail. Although differentiating returns using a more granular segmentation will have shown more variation in mean returns across sectors, I expect that the range of individual property returns would have remained just as wide.
So, what drives these wide variations in property returns and what are the implications for asset allocation?
“The key to superior performance from property management is therefore to grind out a margin of superior performance from every situation”
Some of the variation in asset returns will have been driven by lease events, such as lettings and vacancies. These factors, as explored by the IPF Report Individual Property Risk in 2015, generate considerable variation in individual property returns depending on whether outcomes exceed expectations or are worse than anticipated. The outcomes of lease events will explain the majority of the very high and very low individual property returns; however, a portfolio with many units is likely to experience a mix of positive and negative outcomes which will, at least partly, cancel each other out at the fund level. After all, what determines a good or bad result will not necessarily be in the control of the manager; a lease expiry can be a boon in a strong occupier market or a drag on performance in a weak market, and a struggling tenant can exercise a break to downsize while a stronger tenant can exercise a break in order to upsize. The key to superior performance from property management is therefore to grind out a margin of superior performance from every situation: if a manager can achieve slightly better outcomes (shorter vacancy periods, lower tenant default rates, etc.) than the sector average then they will generate superior sector returns (known as alpha).
This still leaves plenty of room for stock selection, driven by buying property that underestimates future rental value growth potential. A fund manager with a knack of selecting more winners than losers can hope to achieve some of the potential superior property returns in a sector. We leave it to the reader to hypothesise how many managers have possessed such stock-picking skills over multiple time periods or, in other words, how repeatable such performance is.
What does this mean for asset allocation? After six years of superior industrial sector performance, managers may be forgiven for thinking that a 100% allocation to industrial is the lowest risk strategy. But history suggests that relative sector performance will alternate over time. So, first, we would need the graphic to include far more time periods to estimate the variability of different sector returns, ie, are some sectors more volatile than others? Further, what is the correlation of sector returns over time (when one sector is performing weakly, is another sector more likely to show stronger returns)?
“The fund manager is essentially benefitting from the ‘free lunch’ of risk diversification by holding a combination of sectors”
The results of such analysis will allow the opportunity to generate superior risk-adjusted portfolio returns through asset allocation to be estimated. The fund manager is essentially benefitting from the ‘free lunch’ of risk diversification by holding a combination of sectors.
The wider spread of individual property returns within segments will still look tempting to many as an opportunity for outperformance. This does present something of a conundrum to fund managers: hold more assets in a portfolio and the likelihood of weak performing property dragging down the stronger performers increases, while holding less stocks increases the opportunity of holding assets from the positive end of the asset return distribution. This equation leads many managers to consider whether there is a ‘sweet spot’ between the number of stocks held and the ability to generate superior returns through stock selection or asset management. Surely if a manager only has to select and manage relatively few properties then the likelihood of stronger returns is increased? Holding a smaller number of properties will, however, increase portfolio risk and so, to compensate for this increased risk, a fund with less assets must generate higher portfolio returns than a portfolio with more holdings. The required superiority in stock selection from holding a few properties to compensate for the increased specific risk in the portfolio should be quantified and considered by managers.
For an external investor the question is similar: does the manager have the asset management skills to achieve superior property returns (alpha)? If so, what are the sources of this alpha? Is it through achieving higher growth, or maybe shorter vacancy periods or lower cost leakage? Managers can measure and communicate these sources of alpha to their investors and explain how they balance selecting assets from the right-hand side of the distribution of property returns with the benefits of risk diversification.


