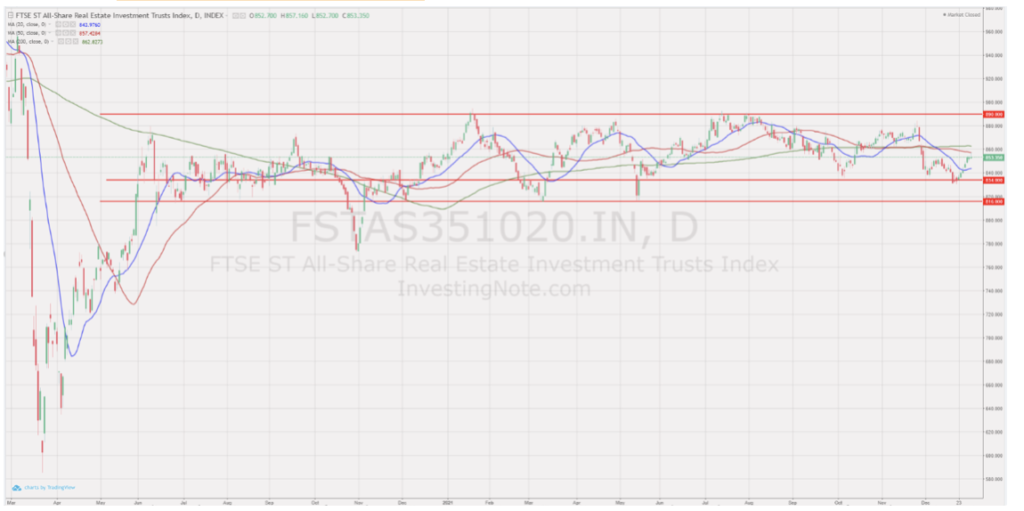
- FTSE ST Real Estate Investment Trusts (FTSE ST REIT Index) increased slightly from 843.73 to 853.35 (1.14%) compared to the last month’s update. Currently the Singapore REIT index is still trading with a range between 816 and 890.
- Yield spread (in reference to the 10-year Singapore government bond of 1.66% as of 31 December 2021) tightened slightly from 4.29% to 4.19%. This is due to the 10- year Singapore government bond rate decreasing less (1.69% to 1.66%) compared to the average REIT yield decreasing from 5.93% to 5.84%.
- The risk premium is attractive to accumulate Singapore REITs in stages to lock in the current price and to benefit from long-term yield after the recovery. Moving forward, it is expected that DPU will increase due to the recovery of global economy, as seen in the previous few earning updates. NAV is expected to be adjusted upward due to revaluation of the portfolio.
- Technically the REIT Index is currently on short term sideways trend, recently bouncing back from its support at 835. Post-pandemic recovery should continue, which can lead to the stablilisation of share prices of Singapore REITs and the return of the dividend for the next few quarters. Based on the latest earning releases, most of the REITs are growing in DPU and cautiously optimistic moving into 2022.
Technical analysis
FTSE ST Real Estate Investment Trusts (FTSE ST REIT Index) decreased slightly from 843.73 to 853.35 (1.14%) compared to the last month’s update. Currently the Singapore REIT index is still trading with a range between 816 and 890.
- As for now, short term direction: Up.
- Medium direction: Sideways.
- Immediate support at 834, followed by 816.
- Immediate resistance at 890.

Price/NAV Ratios Overview
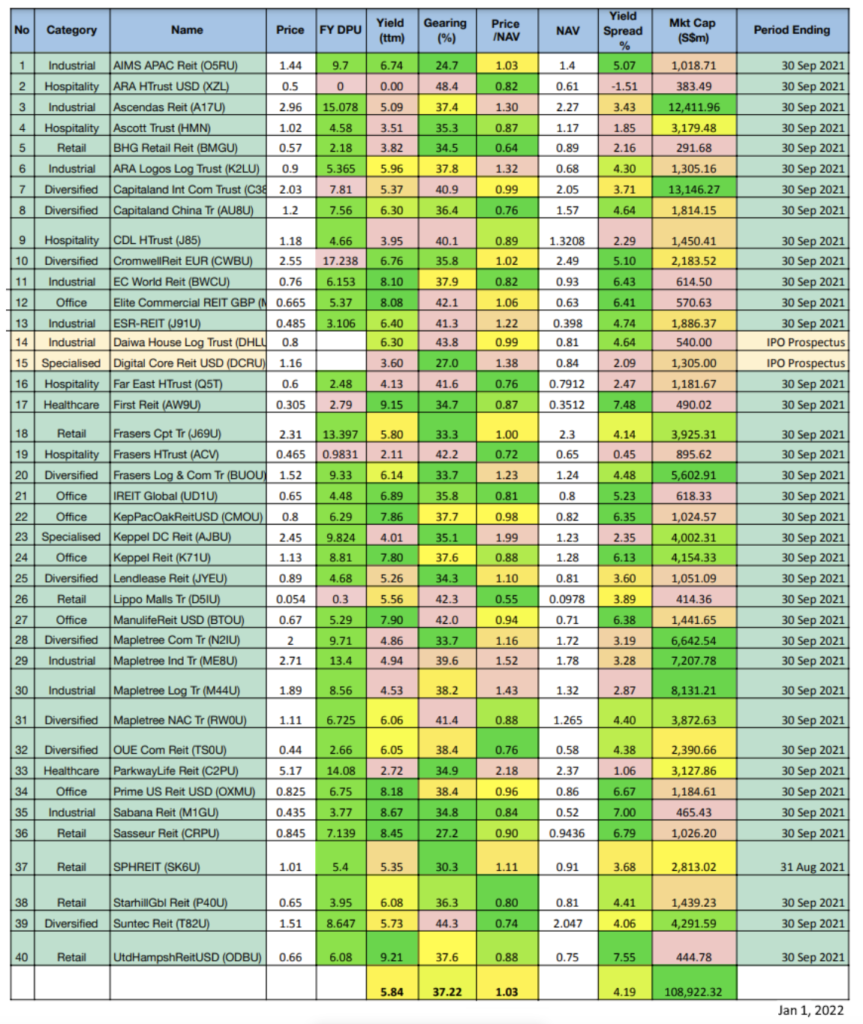
- Price/NAV increased to 1.03
- Increased from 1.00 in December 2021.
- Singapore Overall REIT sector is slightly above fair value now.
- Take note that NAV is adjusted downward for most REITs due to drop in rental income during the pandemic (Property valuation is done using DCF model or comparative model).
- Most overvalued REITs (based on Price/NAV)
- Parkway Life REIT (Price/NAV = 2.18).
- Keppel DC REIT (Price/NAV = 1.99).
- Mapletree Industrial Trust (Price/NAV = 1.52).
- Mapletree Logistics Trust (Price/NAV = 1.43).
- Digital Core REIT (Price/NAV = 1.38).
- ARA LOGOS Logistics Trust (Price/NAV = 1.32).
- Most undervalued REITs (based on Price/NAV)
- Lippo Malls Indonesia Retail Trust (Price/NAV = 0.55).
- BHG Retail REIT (Price/NAV = 0.64).
- Frasers Hospitality Trust (Price/NAV = 0.72).
- Suntec REIT (Price/NAV = 0.74).
- Far East Hospitality Trust (Price/NAV = 0.76).
- OUE Commercial REIT (Price/NAV = 0.76).
Distribution yields overview
- TTM Distribution Yield decreased to 5.84%
- Decreased from 5.93% in December 2021.
- 10 of 40 (25%) Singapore REITs have distribution yields of above 7%.
- Do take note that these yield numbers are based on current prices taking into account the delayed distribution/dividend cuts due to COVID-19, and economic recovery.
- Highest distribution yield REITs (ttm)
- United Hampshire REIT (9.21%).
- First REIT (9.15%).
- Sabana REIT (8.67%).
- Sasseur REIT (8.45%).
- Prime US REIT (8.18%).
- EC World REIT (8.10%).
- Reminder that these yield numbers are based on current prices taking into account delayed distribution/dividend cuts due to COVID-19.
- Some REITs opted for semi-annual reporting and thus no quarterly DPU was announced.
Gearing ratios overview
- Gearing ratio remained at 37.22%
- Remained at 37.22% in December 2021.
- Gearing Ratios are updated quarterly. Thus there is no change to the Gearing Ratios.
- In general, Singapore REITs sector gearing ratio is healthy but increased due to the reduction of the valuation of portfolios and an increase in borrowing due to Covid-19.
- Highest gearing ratio REITs
- ARA Hospitality Trust (48.4%).
- Suntec REIT (44.3%).
- Daiwa House Logistics Trust (43.8%).
- Lippo Malls Retail Trust (42.3%).
- Frasers Hospitality Trust (42.2%).
- Elite Commercial REIT (42.1%).
Market capitalisation overview
- Total Singapore REIT Market Capitalisation increased by 2.63% to S$108.9 Billion.
- Increased from S$106.1 Billion in December 2021.
- Contributed by IPO listing of Daiwa House Logistic Trust and Digital Core REIT.
- Biggest market capitalisation REITs:
- Capitaland Integrated Commercial Trust ($13.15B)
- Ascendas REIT ($12.41B)
- Mapletree Logistics Trust ($8.13B)
- Mapletree Industrial Trust ($7.21B)
- Mapletree Commercial Trust ($6.64B)
- No change in Top 5 rankings since August 2021.
- Smallest market capitalisation REITs:
- BHG Retail REIT ($92M).
- ARA Hospitality Trust ($383M).
- Lippo Malls Indonesia Retail Trust ($414M).
- United Hampshire REIT ($445M).
- Sabana REIT ($465M).
- No change in Top 5 rankings from December 2021.
Fundamental analysis of 40 Singapore REITs
The following is the compilation of 40 Singapore REITs with colour coding of the Distribution Yield, Gearing Ratio and Price to NAV Ratio.
- Note 1: The Financial Ratio are based on past data and there are lagging indicators.
- Note 2: This REIT table takes into account the dividend cuts due to the COVID-19 outbreak. Yield is calculated trailing twelve months (ttm), therefore REITs with delayed payouts might have lower displayed yields, thus yield displayed might be lower.
- Note 3: All REITs highlighted in green have been updated with the latest Q3 2021 business updates/earnings.
- Note 4: 2 REITs submitted their IPOs in November 2021. REITs highlighted in yellow have values extracted from IPO Prospectuses. Yield is calculated based on Estimated DPU / Price, with the Estimated DPU calculated from the Prospectus.


