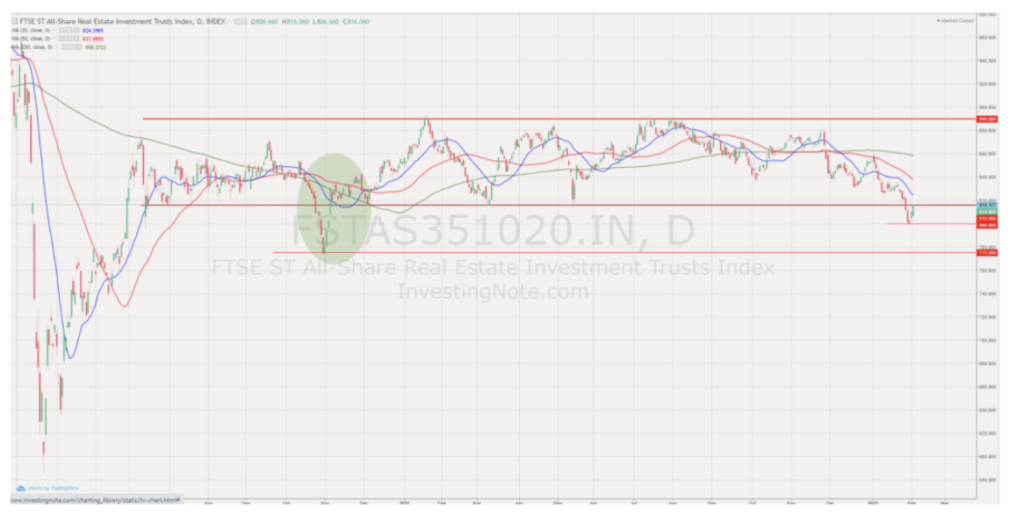
- FTSE ST Real Estate Investment Trusts (FTSE ST REIT Index) decreased from 853.35 to 816.11 (-4.37%) compared to the last monthly update. The Singapore REIT index broke the support level of 816 to a low of 799, but has since rebounded to 816.
- Yield spread (in reference to the 10-year Singapore government bond of 1.78% as of 5 February 2021) remained almost the same, changing from 4.19% to 4.18%. As the interest rate hike approaches, and government bond yields increases, this would, in theory, tighten the yield spread (as the DPU from S-REITs are lagged). Some fund managers may be doing portfolio rebalancing to keep the yield spread criteria intact, which may have caused the recent price corrections across the S-REIT market, increasing S-REIT yields (ttm yields remaining stable with a drop in price leads to increased ttm% yield). Therefore, Yield Spreads remained largely the same due to both government bonds and S-REIT average yields increasing.
- The risk premium remains attractive (compared to other asset classes) to accumulate Singapore REITs in stages to lock in the current price and to benefit from long-term yield after the recovery, especially since the S-REIT Market is undervalued. Moving forward, it is expected that DPU will continue to increase due to the recovery of the global economy, as seen in the previous few earning updates. NAV is expected to be adjusted upward due to revaluation of the portfolio.
- Technically the FTSE ST REIT index has broken the critical 816 support and currently rebounded to test the 816 level. If the REIT index is able to go above this level, the bearish breakout will be negated as this is considered a false breakdown. Otherwise, the REIT index will continue the downtrend towards 800 and 775.
Technical analysis
FTSE ST Real Estate Investment Trusts (FTSE ST REIT Index) decreased from 853.35 to 816.11 (-4.37%) compared to the last month update. The Singapore REIT index broke the support level of 816 to a low of 799, but has since rebounded to 816.
- Short-term direction: down.
- Medium-term direction: down.
- Immediate Support at 800, followed by 775.
- Immediate Resistance at 816.
Due to the recent correction, Immediate Support is now 800 (partially a psychological support since 800 is a round number) and Immediate Resistance is now 816. In order to return to the range the Index was trading in for the past 18 months (between 816 and 890, the 2 thick red lines), the Index has to break above the Immediate Resistance of 816. This has happened back in November of 2020 (highlighted green). Failing to do so, the following support is at 775.

Price/NAV Ratios Overview
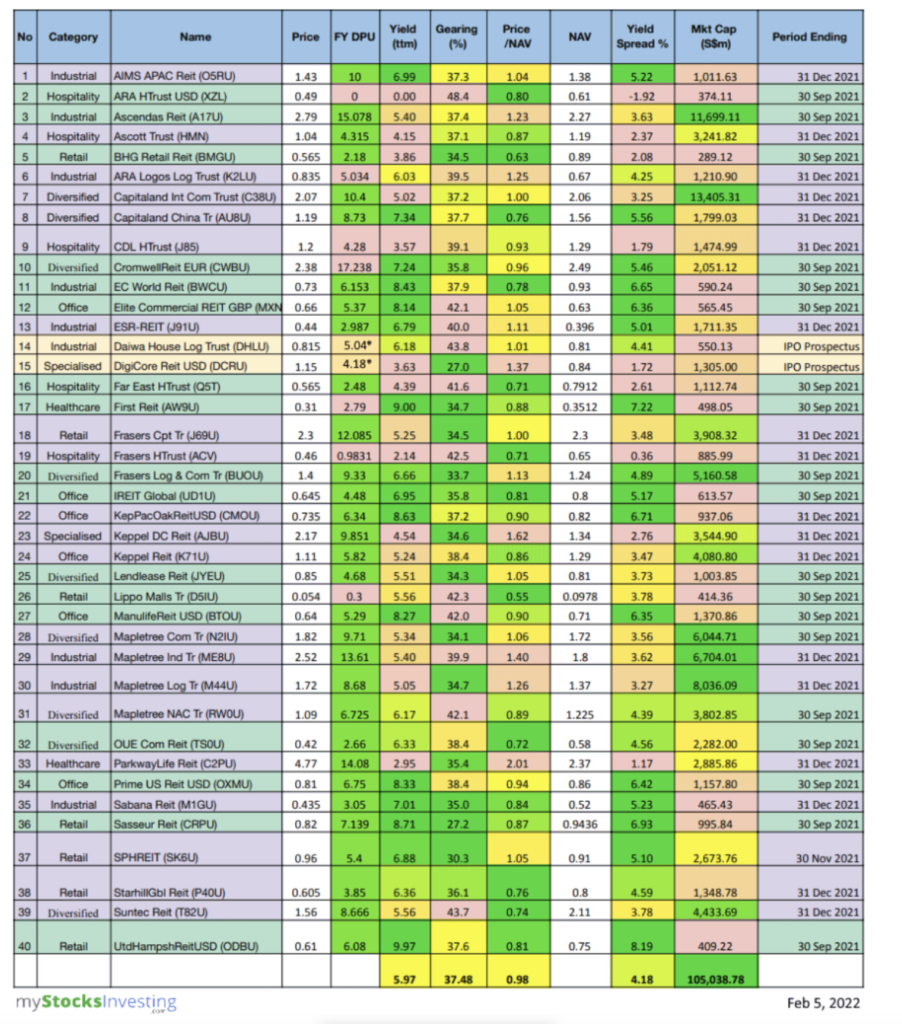
- Price/NAV decreased to 0.98.
- Decreased from 1.03 in January 2021.
- Singapore Overall REIT sector is slightly undervalued now.
- Take note that NAV is adjusted downward for most REITs due to drop in rental income during the pandemic (Property valuation is done using DCF model or comparative model).
- Most overvalued REITs (based on Price/NAV)
- Parkway Life REIT (Price/NAV = 2.01).
- Keppel DC REIT (Price/NAV = 1.62).
- Mapletree Industrial Trust (Price/NAV = 1.40).
- Digital Core REIT (Price/NAV = 1.37).
- Mapletree Logistics Trust (Price/NAV = 1.26).
- ARA LOGOS Logistics Trust (Price/NAV = 1.25).
- Most undervalued REITs (based on Price/NAV)
- Lippo Malls Indonesia Retail Trust (Price/NAV = 0.55).
- BHG Retail REIT (Price/NAV = 0.63).
- Frasers Hospitality Trust (Price/NAV = 0.71).
- Far East Hospitality Trust (Price/NAV = 0.71).
- OUE Commercial REIT (Price/NAV = 0.72).
- Suntec REIT (Price/NAV = 0.74).
Distribution Yields Overview
- TTM Distribution Yield increased to 5.97%.
- Increased from 5.84% in January 2021.
- 11 of 40 Singapore REITs have distribution yields of above 7%.
- Do take note that these yield numbers are based on current prices taking into account the delayed distribution/dividend cuts due to COVID-19, and economic recovery.
- Main reason for yield increases has been due to the general overall drop of REIT prices, therefore increasing yield on costs.
- Highest Distribution Yield REITs (ttm)
- United Hampshire REIT (9.97%).
- First REIT (9.00%).
- Sasseur REIT (8.71%).
- Keppel Pacific Oak US REIT (8.63%).
- EC World REIT (8.43%).
- Prime US REIT (8.33%).
- Reminder that these yield numbers are based on current prices taking into account delayed distribution/dividend cuts due to COVID-19.
- Some REITs opted for semi-annual reporting and thus no quarterly DPU was announced.
- A High Yield should not be the sole ratio you should look for when choosing a REIT to invest in.
Gearing Ratios Overview
- Gearing Ratio increased to 37.48%.
- Increased from 37.22% in January 2021.
- Gearing Ratios are updated quarterly. Thus only some REITs have updated gearing ratios (highlighted in purple)
- In general, Singapore REITs sector gearing ratio is healthy but increased due to the reduction of the valuation of portfolios and an increase in borrowing due to Covid-19.
- Highest Gearing Ratio REITs
- ARA Hospitality Trust (48.4%).
- Daiwa House Logistics Trust (43.8%).
- Suntec REIT (43.7%).
- Frasers Hospitality Trust (42.5%).
- Lippo Malls Retail Trust (42.3%).
- Elite Commercial REIT (42.1%).
Market Capitalisation Overview
- Total Singapore REIT Market Capitalisation decreased by 3.58% to S$105.0 Billion.
- Decreased from S$108.9 Billion in January 2021.
- Contributed by IPO listing of Daiwa House Logistic Trust and Digital Core REIT.
- Biggest Market Capitalisation REITs:
- Capitaland Integrated Commercial Trust ($13.41B).
- Ascendas REIT ($11.70B).
- Mapletree Logistics Trust ($8.04B).
- Mapletree Industrial Trust ($6.70B).
- Mapletree Commercial Trust ($6.04B).
- No change in Top 5 rankings since August 2021.
- Smallest Market Capitalisation REITs:
- BHG Retail REIT ($289M).
- ARA Hospitality Trust ($374M).
- United Hampshire REIT ($409M).
- Lippo Malls Indonesia Retail Trust ($414M).
- Sabana REIT ($465M).
- No change in Top 5 rankings since December 2021.
Fundamental analysis of 40 Singapore REITs
The following is the compilation of 40 Singapore REITs with colour coding of the Distribution Yield, Gearing Ratio and Price to NAV Ratio.
- The Financial Ratios are based on past data and there are lagging indicators.
- This REIT table takes into account the dividend cuts due to the COVID-19 outbreak. Yield is calculated trailing 12 months (ttm), therefore REITs with delayed payouts might have lower displayed yields, thus yield displayed might be lower for more affected REITs.
- REITs updated with the latest Q4 2021 business updates/earnings are highlighted in purple.
- REITs updated with last quarter’s Q3 2021 business updates/earnings are highlighted in green.
- Two REITs submitted their IPOs in November 2021. They are highlighted in yellow and have their values extracted from IPO Prospectuses. Yield is calculated based on *Estimated DPU (calculated from the Prospectus) / Current Price.


