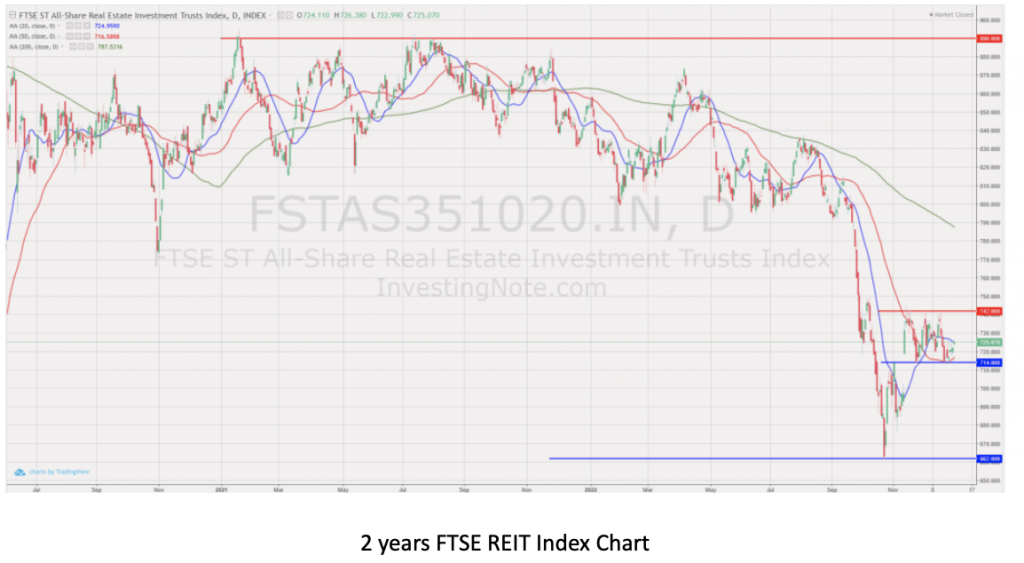
- FTSE ST Real Estate Investment Trusts (FTSE ST REIT Index) increased from 723.18 to 725.07 (0.26%) compared to last month’s update. The REIT Index has rebounded from the sell-off in September and October and since early November has been within the range of 714 and 742. It has been moving sideways for the past 2 months. This is a typical flag pattern after a strong move.
- Yield spread (in reference to the 10-year Singapore government bond yield of 3.11% as of 30th December 2022) widened from 4.61% to 4.69%. This is a slight increase of 0.08% due to the share price erosion outpaces in the increase of the risk-free rate.

Technical analysis
Technical analysis
Technically, FTSE ST REIT Index is trading in a bearish territory but rebounded strongly from the support level. The index is forming a flag pattern (either bull flag or bear flag) and future direction is unknown until the breakout. Breaking up from the flag pattern shows the continuation of the bullish rebound. However, breaking down from the flag pattern indicates the previous rebound is just a dead cat bounce and the REIT index may crash down to test the support of 665 level.
- Short-term direction: Sideways (20D SMA is moving sideways)
- Medium-term direction: Sideways (50D SMA is moving sideways)
- Long-term direction Down (200D SMA is sloping down)
- Immediate Support at 714
- Immediate Resistance at 742

Based on the current overall S-REIT P/NAV of 0.80 and the potential peaking of interest rate in Q2/Q3 2023, the probability to have a severe crash in S-REIT is low unless we are entering into severe recession with big drop in DPU and US Fed continues to increase the interest rate fiercely beyond 5%.
Fundamental Analysis of 38 Singapore REITs
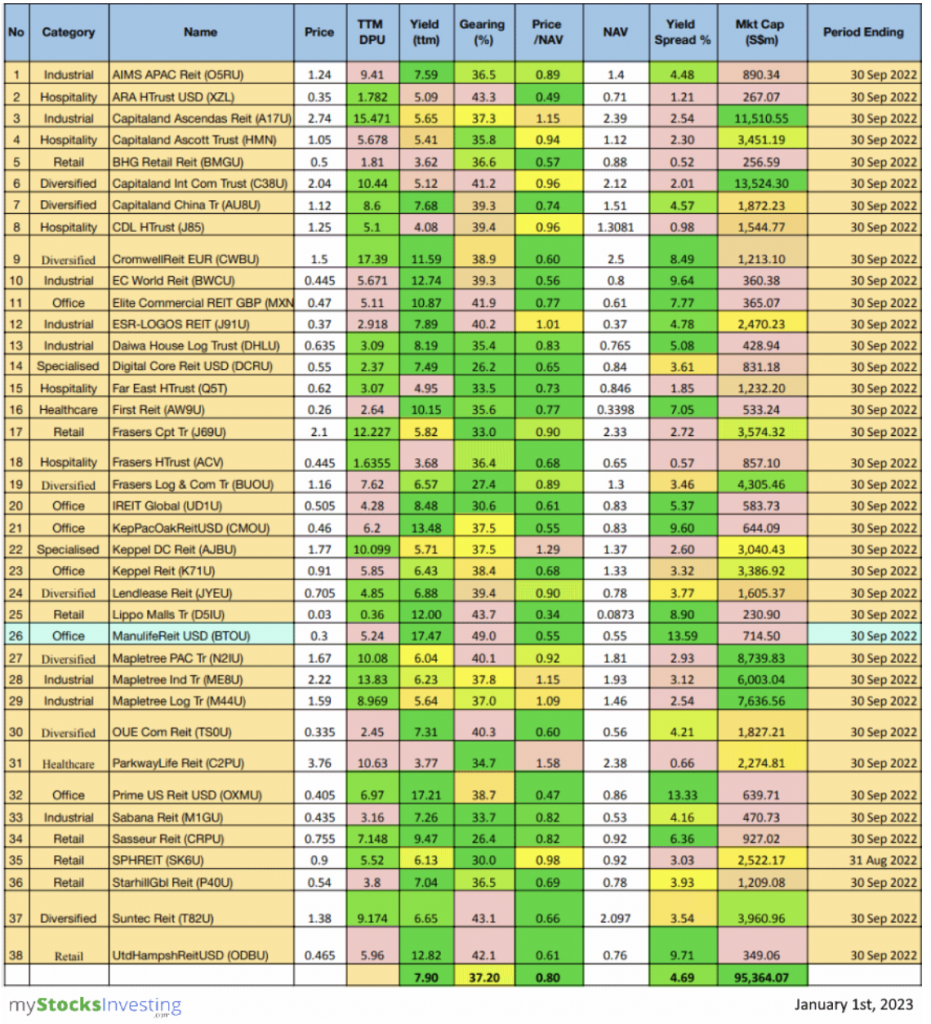
The following is the compilation of 38 Singapore REITs with colour-coding of the Distribution Yield, Gearing Ratio and Price to NAV Ratio.
Price/NAV Ratios Overview
- Price/NAV remained at 0.80.
- Remained at 0.80 since December 2022.
- There has been a recent sell-off in September-October period.
- Singapore Overall REIT sector is undervalued now.
- Take note that NAV is adjusted upwards for some REITs due to pandemic recovery.
- Most overvalued REITs (based on Price/NAV)
- Parkway Life REIT (Price/NAV = 1.58)
- Keppel DC REIT (Price/NAV = 1.29)
- Capitaland Ascendas REIT (Price/NAV = 1.15)
- Mapletree Industrial Trust (Price/NAV = 1.15)
- Mapletree Logistics Trust (Price/NAV = 1.09)
- ESR-LOGOS REIT (Price/NAV = 1.01)
- Only 6 REITs are overvalued now based on Price/NAV value.
- No change in the Top 2 compared to the past 2 months.
- Most undervalued REITs (based on Price/NAV)
- Lippo Malls Indonesia Retail Trust (Price/NAV=0.34)
- Prime US REIT (Price/NAV = 0.47)
- ARA US Hospitality Trust (Price/NAV = 0.49)
- Manulife US REIT (Price/NAV = 0.55)
- Keppel Pacific Oak US REIT (Price/NAV = 0.55)
- EC World REIT (Price/NAV = 0.56)
Distribution Yields Overview
- TTM Distribution Yield increased to 7.90%.
- Increased from 7.67% in December 2022.
- 19 of 40 Singapore REITs have distribution yields of above 7%.
- Do take note that these yield numbers are based on current prices taking into account the delayed distribution/dividend cuts due to COVID-19, and economic recovery. The recent sell-off contributed to the increase in average yield.
- 9 REITs have a ttm yield of over 10%!
- Highest Distribution Yield REITs (ttm)
- Manulife US REIT (17.67%)
- Prime US REIT (17.21%)
- Keppel Pacific Oak US REIT (13.48%)
- United Hampshire US REIT (12.82%)
- EC World REIT (12.74%)
- Lippo Malls Indonesia Retail Trust (12.00%)
- Reminder that these yield numbers are based on current prices taking into account delayed distribution/dividend cuts due to COVID-19.
- Some REITs opted for semi-annual reporting and thus no quarterly DPU was announced.
- A High Yield should not be the sole ratio to look for when choosing a REIT to invest in.
- Yield Spread widened to 4.69%.
- Widened slightly from 4.61% in December 2022.
Gearing Ratios Overview
- Gearing Ratio increased to 37.20%.
- Increased from 37.03% from December 2022.
- Gearing Ratios are updated quarterly. Only Manulife US REIT have an updated gearing ratio value in the past month.
- Highest Gearing Ratio REITs
- Manulife US REIT (49.0%)
- Lippo Malls Indonesia Retail Trust (43.7%)
- ARA Hospitality Trust (43.3%)
- Suntec REIT (43.1%)
- United Hampshire US REIT (42.1%)
- Elite Commercial REIT (41.9%)
Market Capitalisation Overview
- Total Singapore REIT Market Capitalisation increased by 0.26% to S$95.36 Billion.
- Increased from S$95.11 Billion in December 2022.
- Biggest Market Capitalisation REITs:
- Capitaland Integrated Commercial Trust ($13.52B)
- Capitaland Ascendas REIT ($11.51B)
- Mapletree Pan Asia Commercial Trust ($8.74B)
- Mapletree Logistics Trust ($7.64B)
- Mapletree Industrial Trust ($6.00B)
- Frasers Logistics & Commercial Trust ($4.31B)
- No change in the rankings since September 2022.
- Smallest Market Capitalisation REITs:
- Lippo Malls Indonesia Retail Trust ($231M)
- BHG Retail REIT ($257M)
- ARA Hospitality Trust ($267M)
- United Hampshire US REIT ($349M)
- EC World REIT ($360M)
- Elite Commercial REIT ($365M)
- No change in the top 3 rankings from last 2 month’s update.
38 Singapore REITs at a glance: REIT Table
- The Financial Ratios are based on past data and these are lagging indicators.
- This REIT table takes into account the dividend cuts due to the COVID-19 outbreak. Yield is calculated trailing twelve months (ttm), therefore REITs with delayed payouts might have lower displayed yields, thus yield displayed might be lower for more affected REITs.
- All REITs highlighted in orange are now updated with the latest Q3 2022 business updates/earnings.
- SPH Reit will be renamed to Paragon REIT from January 3rd, 2023, onwards.
- Manulife US REIT (highlighted in blue) has Gearing, Price/NAV and NAV/Unit values updated according to the recent media conference.
What does each column mean?
- FY DPU: If Green, FY DPU for the recent 4 Quarters is higher than that of the preceding 4 Quarters.If Lower, it isRed.
- Yield (ttm): Yield, calculated by DPU (trailing twelve months) and Current Price as of December 30th 2022.
- Digital Core REIT and Daiwa House Logistics Trust: Yield calculated from trailing six months distribution, TTM yield is annualised.
- Gearing (%): Leverage Ratio.
- Price/NAV: Price to Book Value. Formula: Current Price over Net Asset Value per Unit.
- Yield Spread (%): REIT yield (ttm) reference to Gov Bond Yields. REITs trading in USD is referenced to US Gov Bond Yield, everything else is referenced to SG Gov Bond Yield.

For more Historical Analysis, you can view my Monthly S-REIT Technical Analysis and REIT Tables dating back to 2015 here.


