Housing activity – starts and permits – posted mixed results in August as declines in the multi-family segment offset gains in the single-family segment. Within the single-family area, there were gains in starts and permits with strength spread across most regions.
Total housing starts fell to a 1.416 million annual rate from a 1.492 million pace in July, a 5.1% decrease. The August decline followed three consecutive gains from an April low.

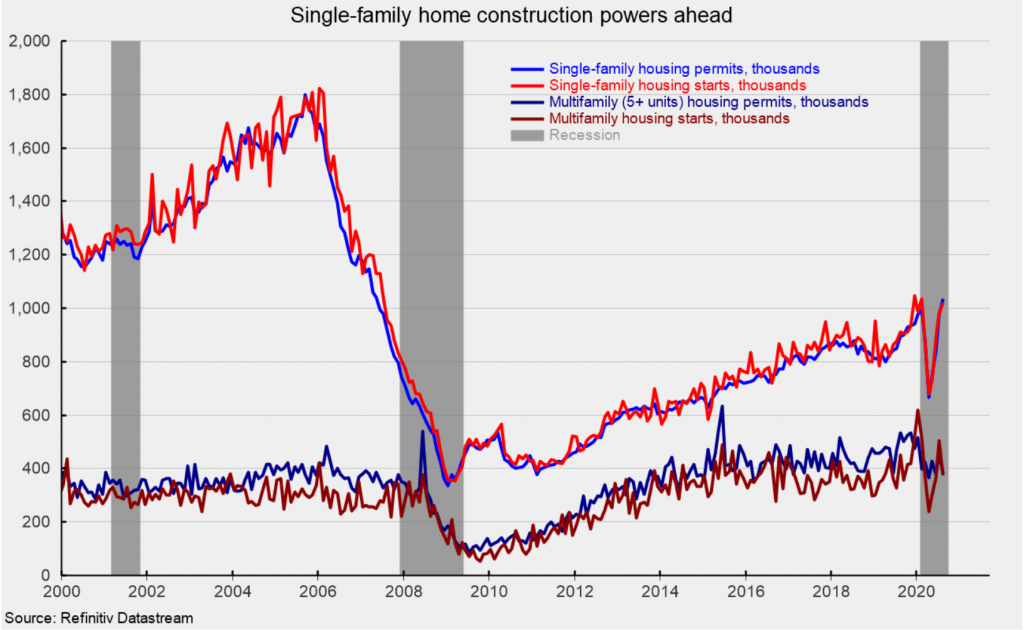
The dominant single-family segment, which accounts for about 70% of new home construction, rose 4.1% for the month to a rate of 1.021 million (see first chart). Starts of multifamily structures with five or more units plunged 25.4% to 375,000 (as shown on the same chart). From a year ago, total starts are up 2.8% with single-family starts up 12.1% and multifamily starts down 16.9%.
Among the regions in the report, total starts rose in two regions and fell in two regions. The Northeast led the decliners with a 33.1% drop while the South, the largest region by volume, declined 17.7%. The Midwest surged 28.4% and the West gained 19.5% for the month. For the single-family segment, the Northeast again led the decliners with a 21.9% drop while the South fell 3.8%. The Midwest gained 20.0% and the West jumped 23.4% for the month
For housing permits, total permits fell 0.9% to 1.47 million from 1.48 million in July. Total permits are 0.1% below the August 2019 level. Single-family permits were up 6.0% at 1.036 million, the highest rate since May 2007 while permits for two- to four-family units gained 17.8% and permits for five or more units decreased 17.4% to 381,000 (see first chart).
Permits for single-family structures are up 15.6% from a year ago while permits for two- to four-family structures are up 26.2% and permits for structures with five or more units are down 28.5% over the past year.

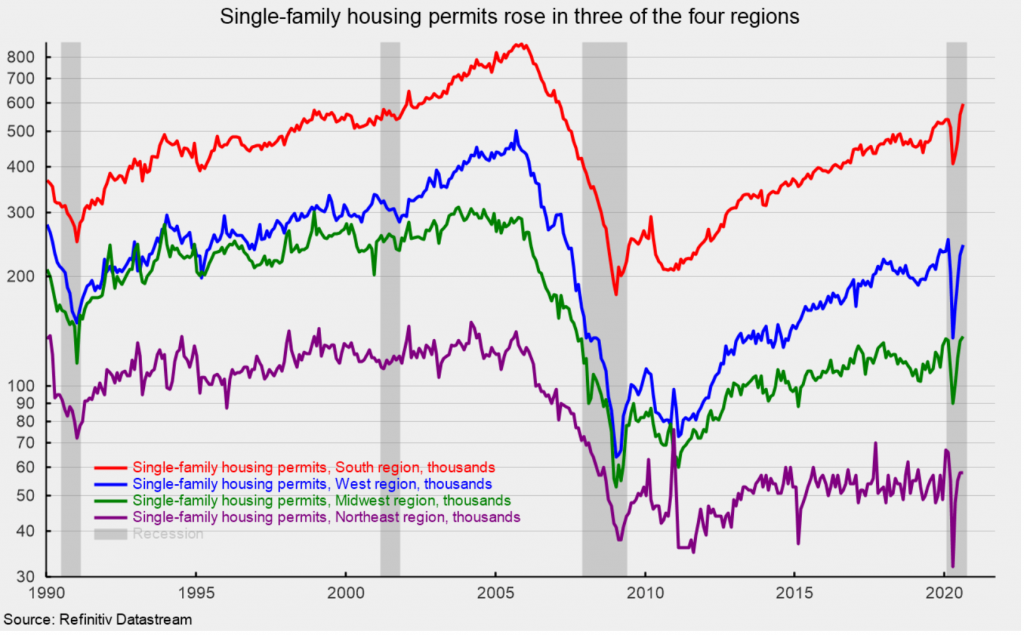
Single-family permits rose in three of the four regions in the report, with the South up 7.0% (the highest since February 2007), the West posting a 7.0% rise, the Midwest also gaining 7.0% but the Northeast unchanged (see second chart). From a year ago, the South is up 16.6%, the West is 13.4% higher, the Midwest gained 22.3% and the Northeast rose 1.8%.
Home construction activity has recovered sharply since the April low as lockdown restrictions that impacted both construction workers and potential customers were eased. Mortgage rates are near all-time lows, providing support for the recovery though lending standards have tightened amid the policy-induced economic malaise.
Housing is one of the areas that may be experiencing structural change. If it is believed that higher-density living represents a higher risk in future pandemics, then there may be sustained added demand for less dense suburban and rural housing, especially single-family dwellings. This trend could be boosted if businesses implement permanent work from home policies, to make employees happy but also to cut down on high-cost commercial real estate, especially in high-density, high-cost cities.
This article was originally published by the American Institute for Economic Research.


