A guide to the requirement.
Solvency II is a comprehensive programme of regulatory requirements for insurers. One of the two financial requirements of Solvency II is the Solvency Capital Requirement (SCR).
The SCR is widely thought to have been implemented as a reaction to the $142bn bailout of American International Group, better known as AIG, which had gambled on selling credit default swaps on collateralised debt obligations (CDOs) and lost that bet in 2008. The EU Solvency II rules, which were eventually introduced on 1 January 2016, were set akin to the regulation of a bank and based on short-term liquidity requirements (banks take short-term deposits and lend over the long-term). The SCR calculation is therefore rather at odds with the position of a typical life insurer with long-term liabilities (annuities) that they match with long-term assets.
The SCR is the amount of funds that insurance and reinsurance companies are required to hold under the European Union’s Solvency II directive in order to have 99.5% confidence they could survive the most extreme expected losses over the course of a year. The SCR charge for property was set to 25%, which was based on the fall in UK capital values in 2008 (-25.9%). However, the liabilities of life insurers have much longer durations than one year, so what would happen if we undertook the analysis over five years?
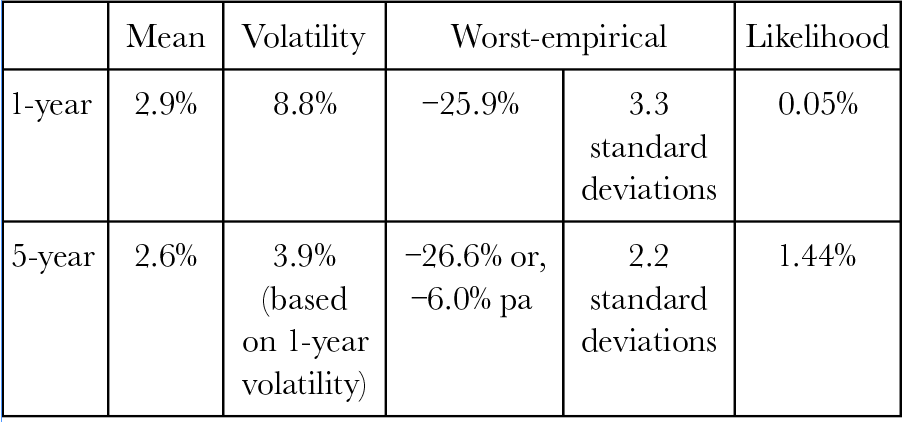
The standard deviation of annual capital growth on the MSCI UK Index (1981-2021) is 8.8%. A 25% fall in the index therefore constitutes 3.3 standard deviations, which has a likelihood of 0.05% (assuming that the series is normally distributed). Over a 5-year period, the volatility would be expected to be 3.9% (8.8%*SQRT[1/5]). The fall of -26.6% from 2007 to 2012, equivalent to -6.0% pa, therefore constitutes 2.2 standard deviations, which has a likelihood of 1.44%.
Changing the measurement period from one to five years would not therefore materially affect the SCR and may even increase it slightly.
Table 1: Likelihood of worst-empirical fall in capital values measured over one and five years

But is this the right approach for a life insurance company with long-term liabilities? The insurer will be earning an income return on their assets, so what answer would we get if we undertook the analysis on total return rather than solely on capital growth?
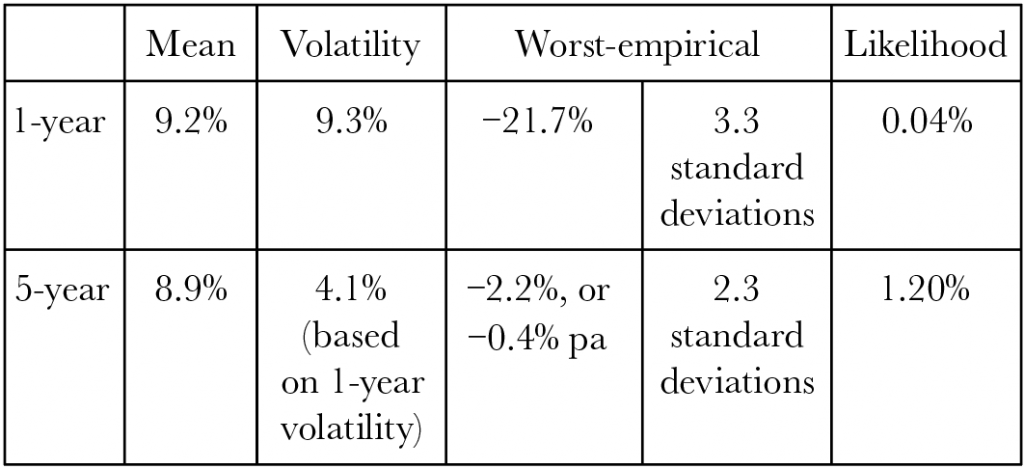
Table 2: Likelihood of worst-empirical total return measured over one and five years

Note that the volatility of total return is about the same as for capital growth (9.3% vs 8.8% for one-year volatility and 4.1% vs 3.9% for five-year volatility). However, the mean total return is much higher (as it includes the income return). The worst empirical outcome for total return over five years is therefore only slightly negative.
“The impact of the rising income component on long-term returns is often noted on equity series when quoting the low likelihood of a negative total return over rolliong 10-year periods”
The result is partly due to the assumed reinvestment of income. As the income return will rise in a downswing, due to the fall in capital values, reinvestment in a downswing generates a strong return. The impact of the rising income component on long-term returns is often noted on equity series when quoting the low likelihood of a negative total return over rolling 10-year periods.
Note also that the higher the initial income return, the lower the likelihood of loss over a long period. The initial yield, therefore, has an impact on the likelihood of loss through time: the higher the initial yield, the lower the likelihood of future losses.
It would seem logical that if the SCR were to be set dynamically in relation to current market pricing, then it could flex through strong and weak market conditions in a counter-cyclical manner: rising when market pricing is high and falling when market pricing is lower. This counter-cyclical characteristic would seem highly desirable for a market as notoriously cyclical as commercial real estate.
The same approach can be taken in constructing any real estate portfolio using the RES Asset Allocation Model.


