Following the crash of 2008/2009 the S&P 500 went on a record-breaking run, gaining around 400% over 11 years before peaking in early 2020.
It then suffered a record-breaking crash thanks to Covid-19, but that was short-lived and the US large-cap index is now setting all-time highs on a regular basis.
At the time of writing the S&P 500 is just below 4,200, which is fractionally below its recently set all-time high. So, the price is high on a historical basis, but so is its valuation according to the CAPE ratio.
Valuing the S&P 500 using its CAPE ratio
If you’re not familiar with the cyclically adjusted PE ratio (CAPE) then here’s a quick summary.
When we value an index, we’re effectively trying to work out if the price is high or low compared to the index’s fair value, ie, the price a rational investor would pay to get their target rate of return.
So we’re trying to compare price to value.
Since nobody knows the true value of an index, we have to make an estimate based on conservative but realistic assumptions.
With the standard PE ratio we’re comparing price to earnings, so we’re using earnings as a proxy for value. If earnings go up then we assume value goes up too, and that’s a reasonable assumption.
But PE only looks at last year’s earnings and earnings in a single year can be very volatile. Intrinsic or fair value, on the other hand, usually isn’t volatile.
For example, if Tesco earns zero profit in a year, it wouldn’t be reasonable to say that Tesco’s fair value was zero.
Obviously the S&P 500’s earnings are more stable than most companies’ and they probably won’t go to zero anytime soon, but they’re still somewhat volatile as the chart below shows.
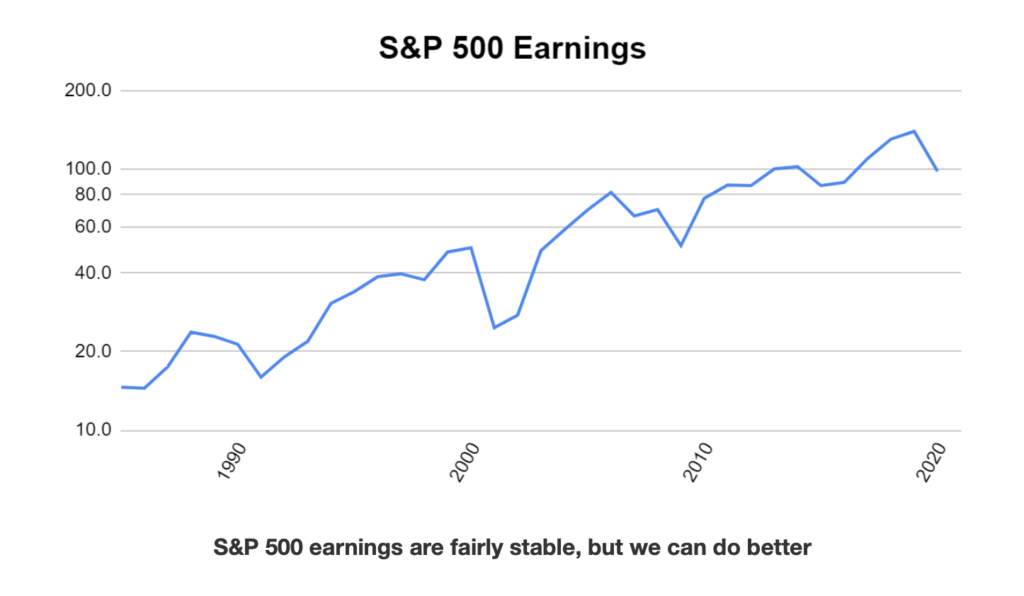
By cyclically adjusting earnings (using their inflation adjusted 10-year average) we get something that’s more stable and more closely related to the fair or intrinsic value of these 500 companies:
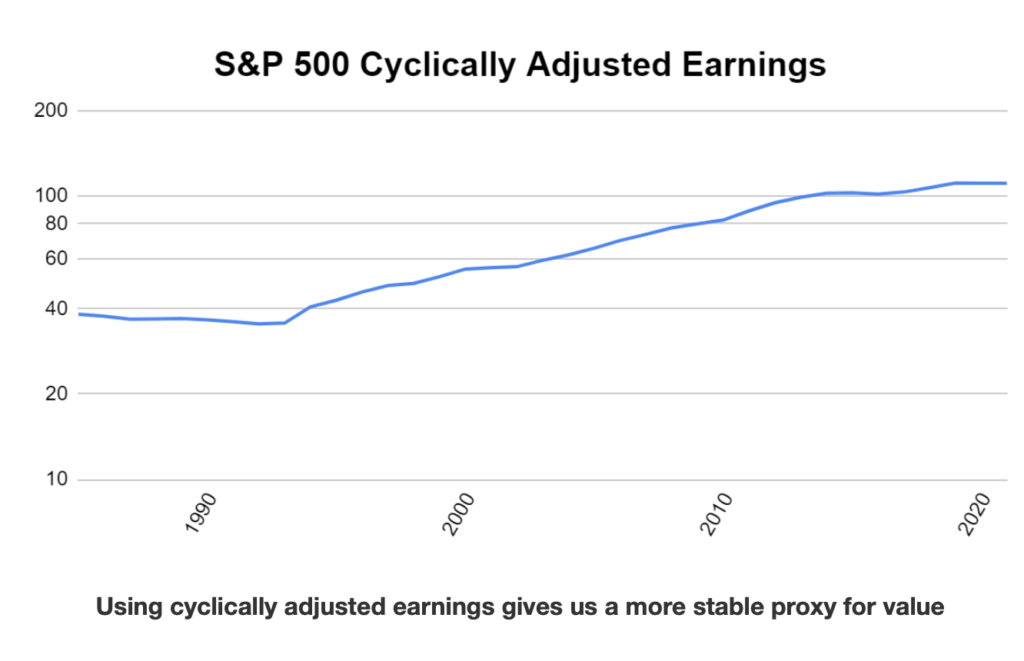
So cyclically adjusting earnings gives us a nice stable number which should be quite closely correlated with value and all we need to do is compare price to those earnings to see if it’s high, low or somewhere in between.
Using CAPE’s long-term average to calculate fair value for the S&P 500
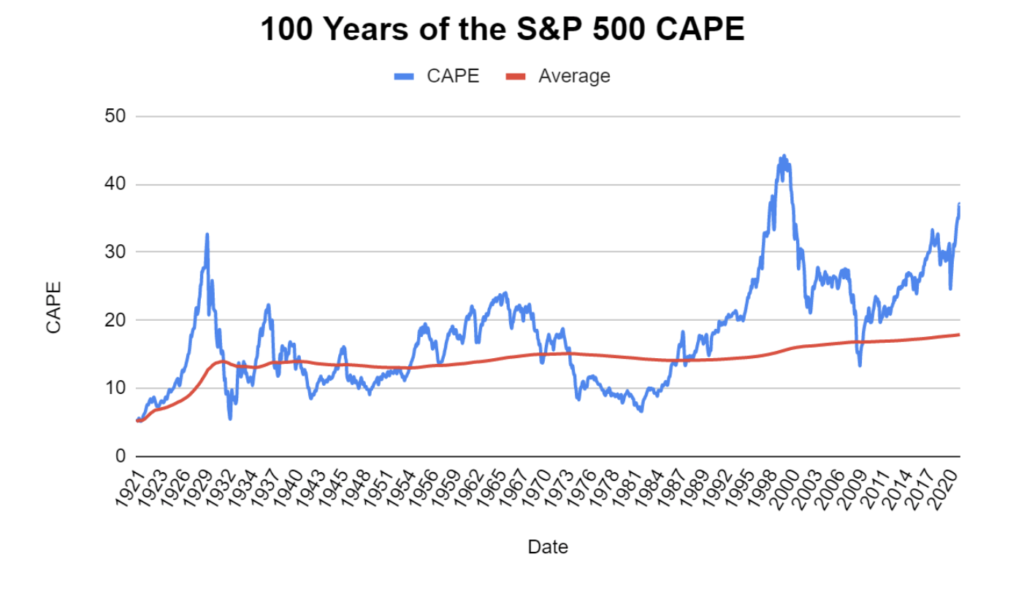
As with the standard PE ratio, we can look at the current CAPE ratio and compare it to its own long-term average to see if it’s historically high or low or somewhere in between.
Since 1985, the S&P 500’s CAPE has averaged about 24 and over the past 100 years its averaged 18. I prefer to use very long-term averages because they’re more stable and that reduces the impact of things like the dot-com bubble or the extended period of low valuations during the 1970s, so I’m going to use 18 as my benchmark.
But there can be issues with using very long-term averages, with the risk being that they’re outdated. For example, the chart below shows that since the mid-1990s, investors have been consistently willing to pay well above average for the S&P 500.
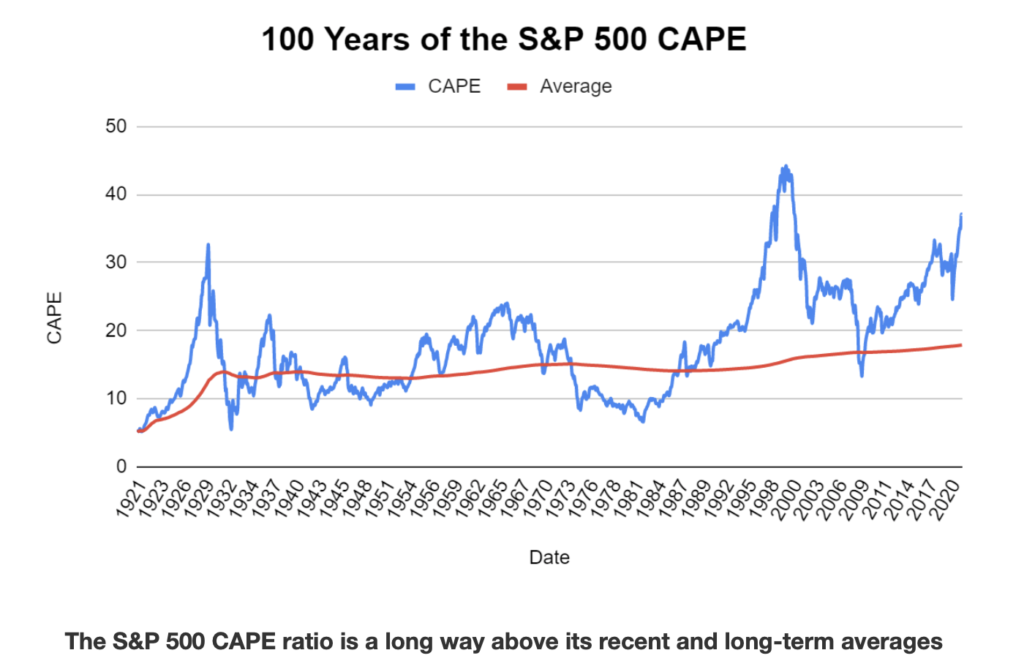
Perhaps it’s worth comparing CAPE today against its 30-year average of 24 as well as its 100-year average of 18.
The S&P 500 CAPE ratio is higher than at any time in history other than the peak of the dot-com bubble
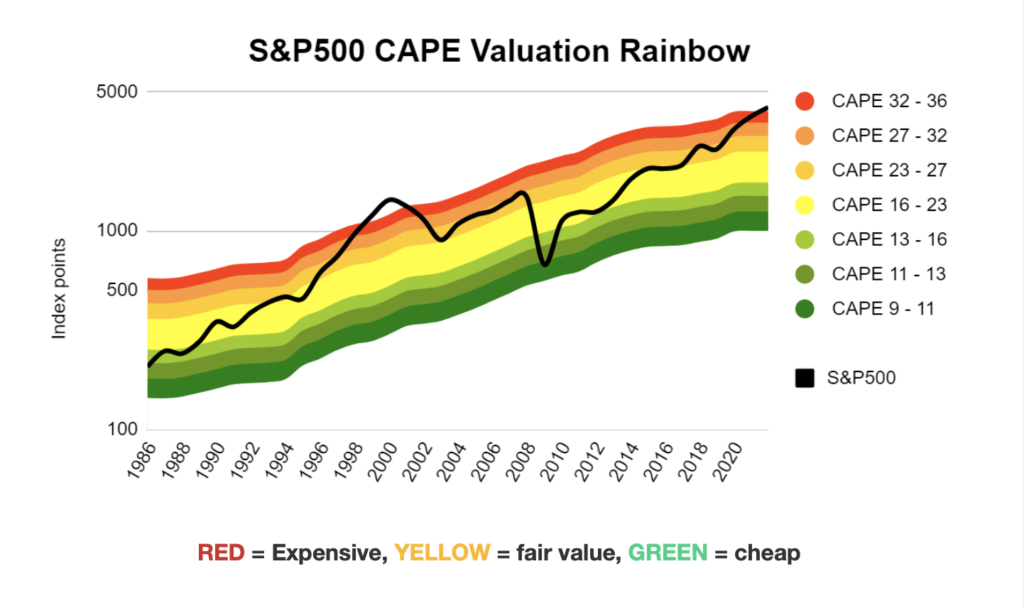
The rainbow chart above shows where the S&P 500 would have been at various CAPE levels.
The top of the rainbow (in red) shows where it would have been at very high valuations, and you can see that in the dot-com bubble the S&P 500 went through the top of the rainbow and into la-la land. The bottom of the rainbow (in green) is where the S&P 500 would be at depressed valuations and perhaps not surprisingly that’s where it ended up during the 2009 crash.
Today the S&P 500’s CAPE is just peeping out above the top of the red zone. From a historical perspective that’s higher than at any time other than the peak of the dot-com bubble.
To be precise, with the S&P 500 just below 4,200, its CAPE ratio is 37. By any reasonable definition this makes the S&P 500 look very expensive and several highly regarded investors have said the S&P 500 is probably in an epic bubble.
Perhaps this time is different, but if history is anything to go by, then being this far above average valuations is not great news if you’re going to be invested in the S&P 500 over the next five, 10 or 20 years.
But simply saying high valuations are not great news for future S&P 500 returns is a bit vague, so here are a few scenarios which will hopefully flesh out those valuation bones.
How the S&P 500’s high CAPE ratio could affect future returns
To help us gaze into the future (or at least the next 10 years) we’ll need to make some assumptions about inflation, earnings and valuation multiples. My aim with these assumptions is to be both conservative and realistic, although since I cannot see into the future they will of course not be 100% accurate.
Here are some reasonable assumptions:
- Inflation over the next 10 years stays in line with the Federal Reserve’s 2% target
- S&P 500 earnings grow at their 30-year average rate of 4% above inflation
Given those assumptions, we can project current earnings into the future and then build scenarios around them to reflect varying levels of investor optimism or pessimism. Here are three plausible scenarios for 2031:
BUBBLE 2031: The S&P 500 is in (yet another) bubble, so CAPE is 36, which is twice the long-term average and well above its 30-year average. The S&P 500 is at 7,200, some 70% above where it is today.
BENIGN 2031: The S&P 500’s CAPE is at an historically average 18, so investors are neither unusually optimistic (as they are today) or unusually pessimistic (as they were during the 2009 crash or for much of the 1970s). The S&P 500 is at 3,600, some 15% or so below where it is today.
If instead we assume CAPE is at its 30-year average of 24 then the S&P 500 would be at 4,800, a mere 15% or so above where it is today.
So either way, if the S&P 500 is at anything like normal valuation levels in 2031 then the index is likely to be either slightly up or slightly down from where it is today. So a repeat of the last decade’s 500% gains seems extremely unlikely.
DEPRESSION 2031: Investors are depressed, perhaps because a global pandemic threatens the prosperity of much of the world’s population. The S&P 500 CAPE has fallen to 9 (half the long-term average) so the S&P 500 has fallen to 1,800. That’s a massive 60% below where it is today.
Of course a huge and protracted market decline seems impossible today, but that’s exactly what investors would have said at the peak of the market in 1929, 1968 or 1999. And they were wrong, because in each case the S&P 500 fell by significantly more than 50% in inflation-adjusted terms, typically taking more than a decade to sustainably exceed its previous highs.
The next 10 years of growth may already be baked into the S&P 500’s price
In summary then, it seems more likely than not that the S&P 500 will stay broadly flat or even decline over the next 10 years if valuation levels and investor optimism return to anything like their historic norms.
And while there is a chance that the S&P 500 can provide sustainable capital gains over that timeframe, it would require some combination of (a) enormous earnings growth, (b) a state of permanent optimism and (c) a willingness by investors to accept permanently lower returns.
I’ll leave you to decide if those conditions are likely or not.
This article originally appeared in UK Value Investor and is reprinted here by permission.


