What on earth is going on?
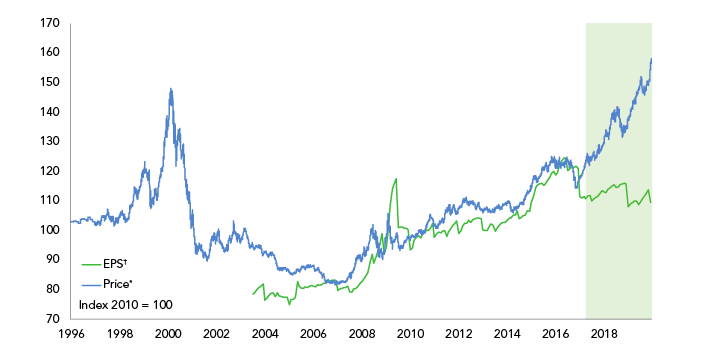
MSCI developed markets growth versus value

Source: Minack Advisors †Ratio of growth/value one year ahead forecast EPS *Growth/value indices for MSCI developed markets
Gravity is a universal constant. But it turns out that zero interest rates can suspend it – in financial markets, at least.
This week’s chart shows the performance of ‘growth’ versus ‘value’ share prices (blue). In green is the performance of ‘growth’ versus ‘value’ earnings.
When the lines rise (or fall) together, growth share prices and earnings are doing better (or worse) than their ‘value’ counterparts. When the lines diverge, relative share price movements are no longer tracking relative earnings strength.
Fierce debate over what constitutes ‘growth’ and ‘value’ companies is itself a universal constant. For our purposes, think US tech giants when you read ‘growth’. And think beaten-up financials and oil majors when you read ‘value’.
Two things make shares go up. Earnings growth and the multiple investors are prepared to pay for those earnings – the P/E1 ‘rating’. All else equal, if a company’s earnings are rising, so will its share price. And post-2008, the chart shows that the outperformance of ‘growth’ was justifiably underpinned by stronger earnings growth.
But in 2017 something strange happens. Growth’s relative earnings performance stalls – and yet the outperformance of growth shares rockets to record highs.
The reason? Ratings. Simply put, investors have been prepared to pay a higher multiple to own ‘growth’ stocks, even when relative earnings strength was waning.
Remarkably, this happened despite the fact that economic growth was accelerating and US interest rates were climbing higher. Both should have been better for ‘value’ given its more direct exposure to economic growth.
So extreme has the move been that several market records have been smashed. Apple’s market capitalisation alone is now greater than the combined value of Germany’s entire DAX index – comprised of the thirty largest listed businesses in Europe’s industrial powerhouse2.
Meanwhile, Microsoft took 42 years to become a $500bn business, then only two years to add the next $500bn. And the five largest listed companies on the S&P 500 now account for a greater share of the index than at any time since the Dot Com bubble3.
The big question is: why?
Zero interest rates suspend the universal forces of financial markets by removing the cost of time. When cash in the bank or government bonds pay you next to – or, increasingly, less than – nothing, investors are prepared to pay almost anything for something.
Cue crowded momentum trades as investors chase returns in a relatively small group of (mainly American) ‘growth’ stories, pushing-up prices and luring in yet more buyers. The ongoing shift from active to passive investment managers adds further fuel to the fire, since passive funds put most money into those stocks which are already the largest in the index.
The trillion dollar question is how long can this go on for?
Perhaps coronavirus or some other ‘black swan’ will spoil the party. Perhaps not. We don’t think timing an inflection point is possible, so Ruffer owns a wide range of equities to profit from a variety of market conditions – with both ‘value’ and ‘growth’ characteristics – whilst the sun still shines.
But we also own specialist protections in order to defend our clients when gravity reasserts its universal nature and pulls asset valuations back to earth with a bump.
Alexander Chartres, Investment Director
1 Price/earnings ratio: where the share price of a company is divided by the earnings per share. The number tells you how many years of current earnings are required to cover the cost of the share.
2 Source: Bloomberg
3 Ibid


