Which US asset classes perform best or worst amid periods of high inflation (6% or more)? Answer: commodities perform best, while bills perform worst. It’s commonly recognised that bonds are not a good inflation hedge – and they aren’t – but less recognised is that equities also fail in this regard; each has returned only a bit more than bills amid periods of higher inflation.
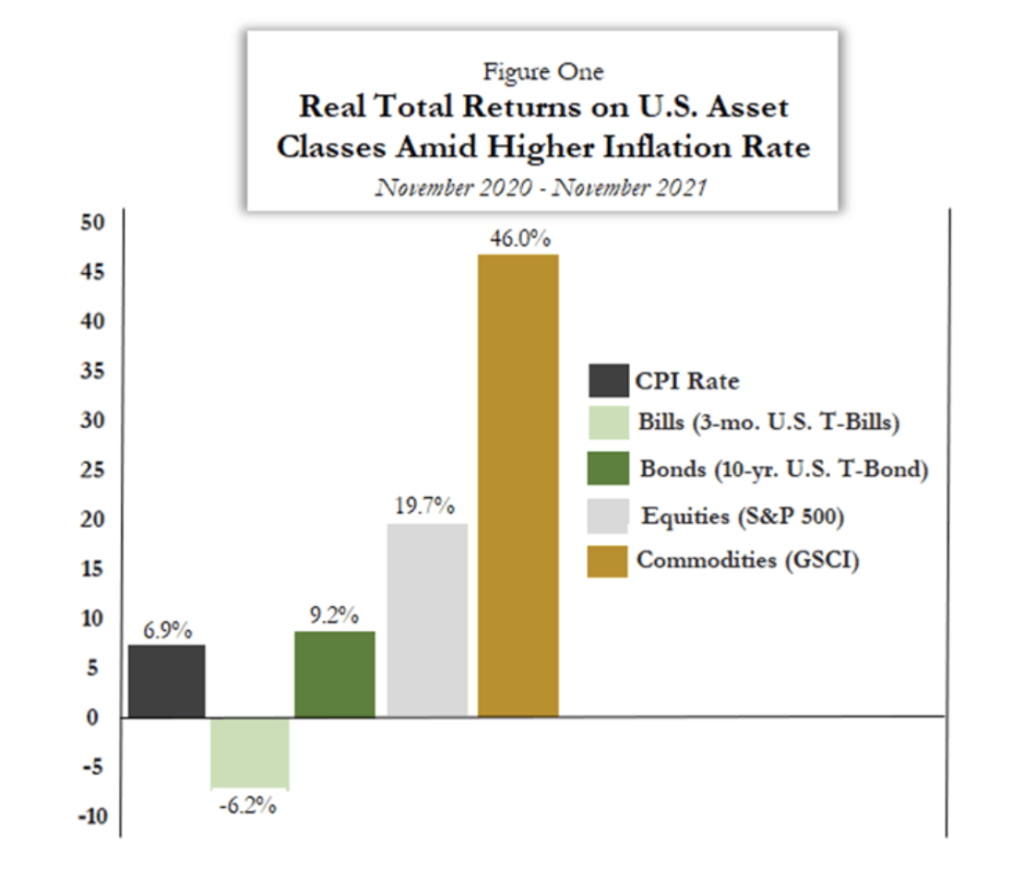
With the US CPI up by 6.9% over the past year – the highest rate since 1982 — have US asset returns reflected this longer-term history? Mostly, but not perfectly. Figure One illustrates how commodities have outperformed all other assets over the past year (through November, the latest available CPI data), with a real gain of 46%. Bills have lost 6.2%, also consistent with the history.
The outlier is equities, which have gained 19.7% in real terms. This is contrary to history. Why? Probably because the Fed until recently chose not to ‘chase’ the higher inflation rate with rate hikes; yet this month it hinted that it would raise rates three times (by 75 basis points) in 2022.
Now consider the longer-term history. Figure Two shows that commodities have materially outperformed equities (13.2% versus 1.8%) under periods of high inflation (averaging 6.7% pa) while significantly underperforming (by -35.7% points pa, or -19.3% versus 16.4%) amid low inflation (average: 1.0% pa). Equities have returned far more (16.4% pa) under episodes of low inflation versus 9.1% pa under moderate inflation and only 1.8% pa under high inflation. Meanwhile, bonds have returned 7.7% pa under low inflation, 5.7% pa under moderate inflation and just 0.9% points pa under high inflation.
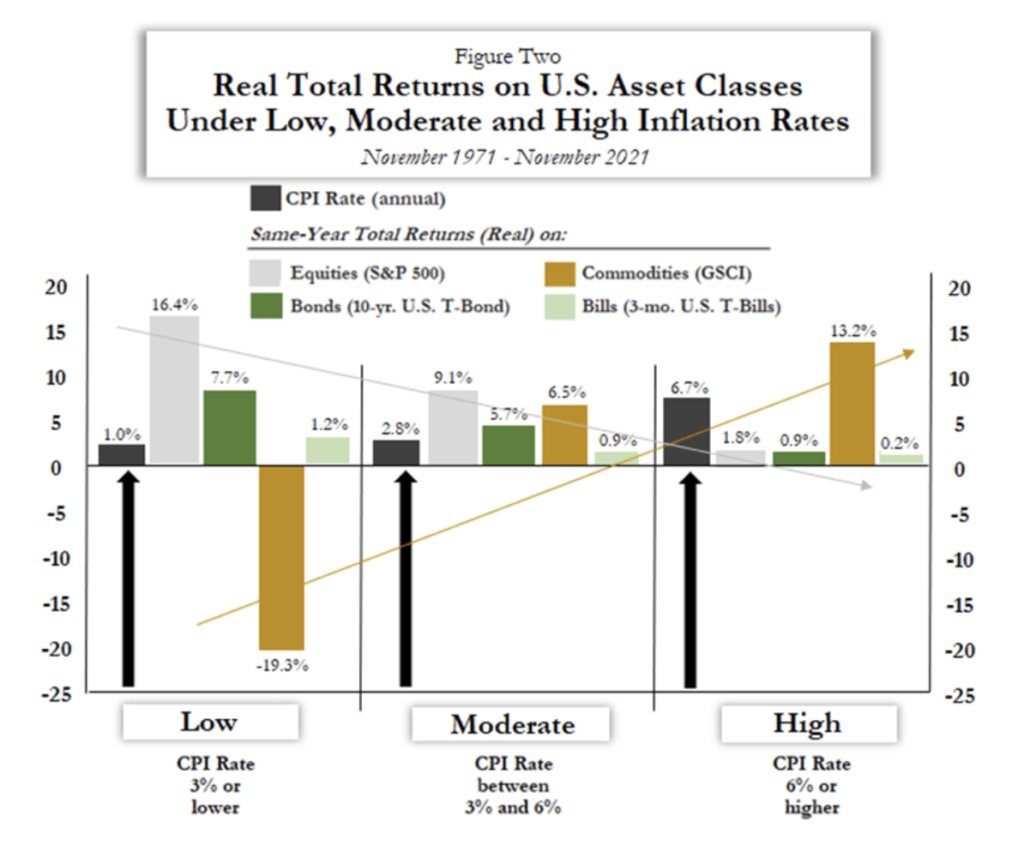
Clearly, financial assets perform poorly under high inflation (versus tangible assets). Less recognised is that equities serve no better than bills or bonds in protecting investors from the erosion of capital caused by high inflation (and by the higher interest rates that typically result). Huge equity gains amid high and rising inflation are historically (and economically) unjustified and unsustainable. Higher inflation also depresses equity valuation (again, due to higher interest rates). US equities are up nearly 20% in real terms over the past year, most likely because we have yet to observe the higher interest rates which tend to accompany higher inflation rates.
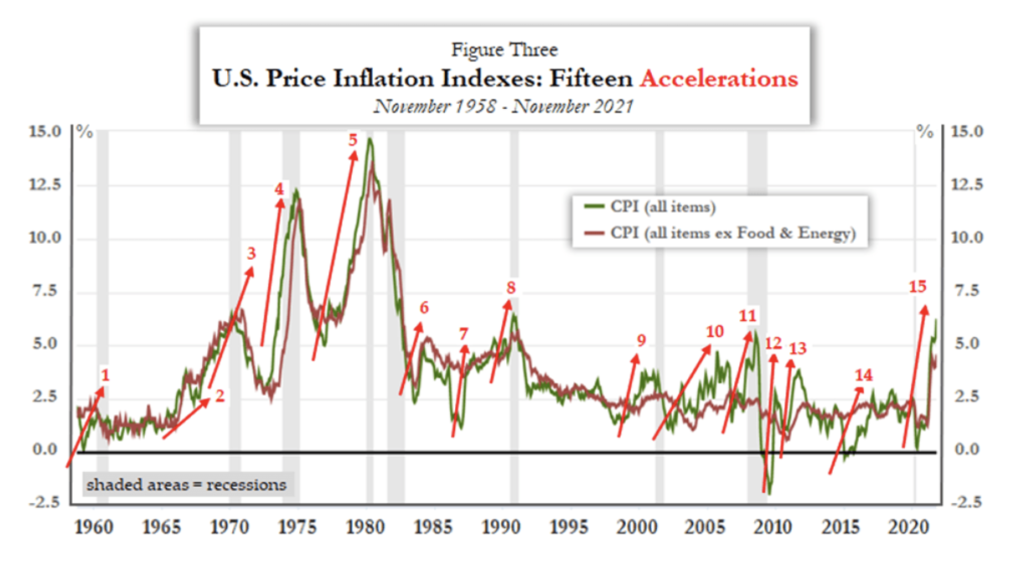
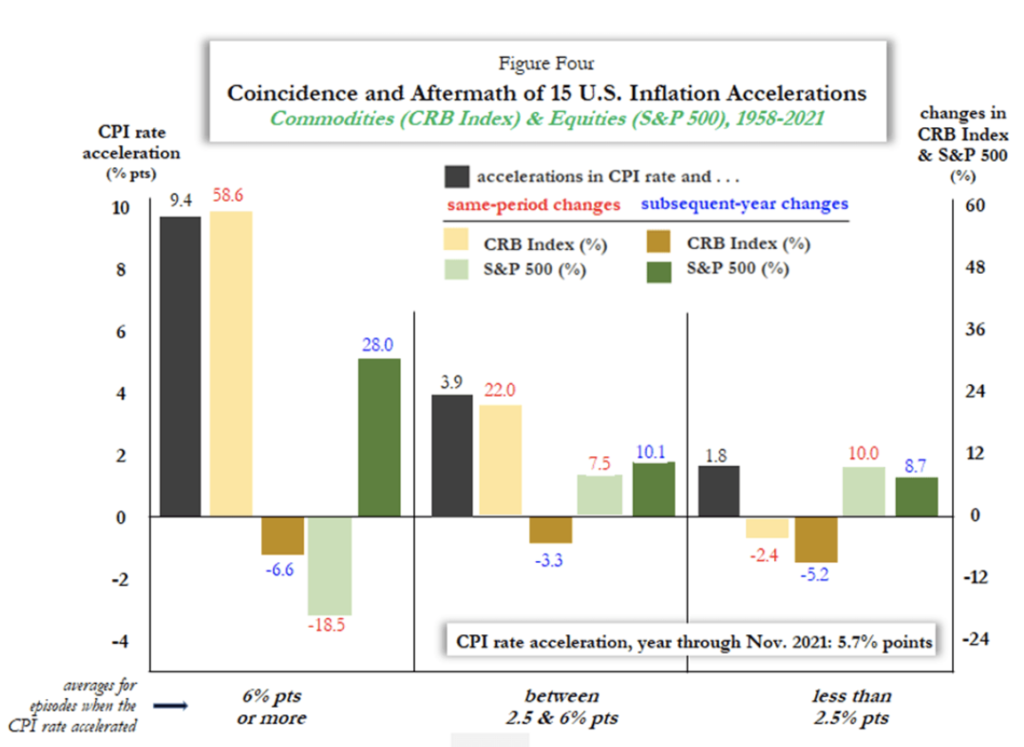
Figure Three shows that Fed Chairman Jay Powell has presided over the biggest US inflation acceleration in decades. What does that mean for US asset returns? We’ve had 15 major inflation accelerations since 1958 (Figure Three). Figure Four makes clear that during these periods commodities have dramatically outperformed equities – and the greater the inflation acceleration, the greater the outperformance. A year later, however, equities beat commodities.
Not until recently has Powell conceded his agency’s culpability in higher US inflation; initially he blamed it on an economic recovery, post-Covid lockdowns (as if more real output causes inflation). Initially he also insisted that higher inflation was “transitory”. Now he’s not so sure. What exactly is his theory of inflation? He’s eclectic about it. It seems he’s got a grab bag of factors.
Is Powell aware that since he became chairman in January 2018 his Fed has increased “high-powered money” (the monetary base = currency plus bank reserves) by 65% (from $3.8tr to $6.4tr)? Over that same period, M1 (spendable money supply = currency plus checkable-transferable accounts) increased by 448% (from $3.7tr to $20.1tr). Inflation is a monetary phenomenon, entailing both money supply and money demand; it is not caused by real factors – whether employment, jobless rates, economic growth rates or “output gaps”.
Just as the Fed has mimicked Bank of Japan (BoJ) policies (with a decadal lag) regarding ZIRP (zero interest rate policy) and QE (quantitative easing), it may now also be copying the BoJ’s long-term policy of largely ignoring accelerating inflation. Japan’s CPI rate has accelerated materially on three occasions since the BoJ adopted ZIRP and QE in the mid-1990s and in each case the BOJ deliberately avoided rate hiking. In the first case Japan’s CPI rate accelerated by 3.1% points (from -0.6% in the year through November 1995 to 2.5% in the year through October 1997); in the second case the rate accelerated by 2.5% points (from -0.2% in the year through September 2007 to +2.3% in the year through July 2008); in the third case the CPI rate accelerated by 5% points (from -1% in the year through March 2013 to +4% in the year through May 2014).
The BoJ resisted raising its policy rate in recent decades because doing so might have raised yields on Japanese Government Bonds (JGBs). It doesn’t want to do that, given that the ratio of Japan’s central government debt to its GDP is now 235% – double what it was in 1998. Japan’s Ministry of Finance wants the BoJ to keep fostering cheap public borrowing. The Fed seems to be acting likewise in recent years and may continue doing so, again mimicking the BoJ by refusing to raise rates (or not raising them materially) not because US inflation is “too low” or high or “transitory”, but because the Fed likewise is intent on satisfying the US Treasury’s need to borrow cheaply. The ratio of US federal debt to GDP ratio is now 125% – double what it was in 2007.
Central banking independence from politics (fiscal profligacy) seems to be a thing of the past.
If the Fed is to be a mere BoJ copycat, does that mean that it can keep US equities artificially elevated by a perpetually low policy rate? No more than the BoJ has been able to do for Japanese equities. The NIKKEI today remains 25% below its all-time high at the end of 1989, not because Japan has suffered deflation (it hasn’t) or too little inflation, but because public policy has imposed dozens of deficit-spending ‘stimulus’ schemes that in truth only deaden incentives and divert capital to fundamentally unproductive public securities. US policymakers are doing likewise, of course.
Originally published by The American Institute for Economic Research and reprinted here with permission.


