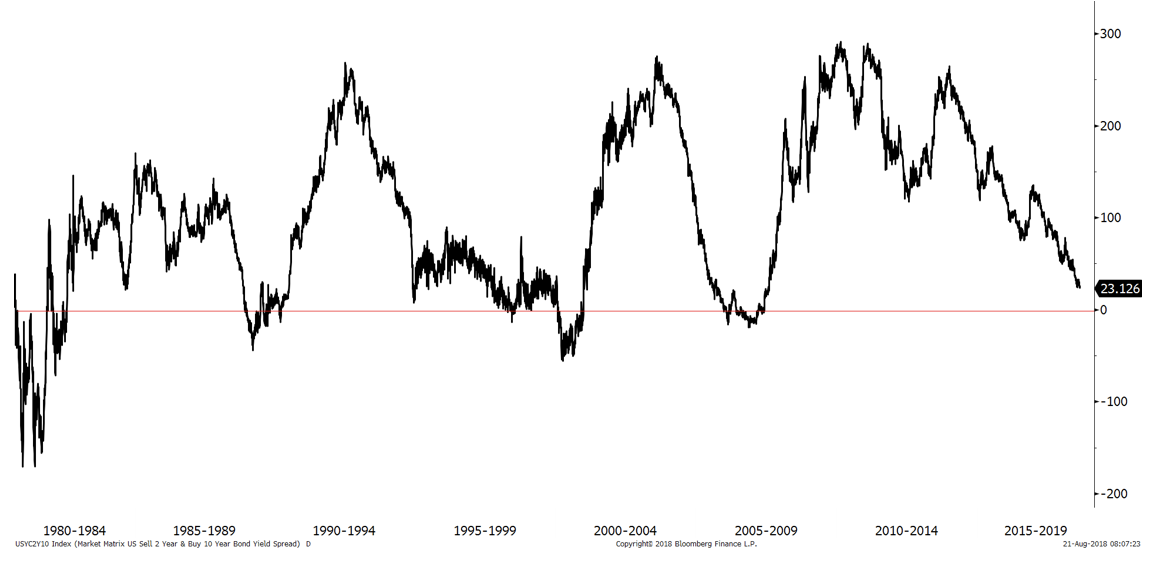
Despite stronger economic growth in Q2 2018, further Fed tightening and a bearish consensus that US interest rates would go substantially higher in 2018/19, financial markets now signal concern about weaker economic growth and inflation. This is shown in (1) the flattening of the US yield curve (10 yr – 2yr yields; see Chart 1), (2) stable inflation breakevens or expectations, (3) a modest de-rating of the US equity market, and (4) flat to weaker equity market performance globally in 2018 v 2017. Forecasts of a decisive break above 3% in 10 year Treasury yields have also been confounded and once again, the financial market consensus on higher growth, inflation and “ normalisation “ of interest rates has been mistaken. It is still too early to declare a final outcome, but the failure of those economies further advanced in the economic cycle – notably the US – to show more than modest late-cycle capacity strains and inflation pressures may have dealt the final blow to those expecting interest rates to “ normalise” at pre-GFC levels.
Since an inverted US yield curve has been a reliable leading indicator of US recessions in 8 of the last 9 business cycles, financial markets are also paying heed to the curve flattening of recent months. This has left the US yield curve at its flattest since 2007 (Chart 1)- with a positive gradient of 23bp – when it inverted 12 months before the deep recession of 2008/09.

Chart 1; US 10 year yield – 2 year yield since 1980; source Bloomberg, 21/08/18.
There may be some factors causing the yield curve to be flatter in this cycle than previously; notably, the Fed’s purchases of MBS (mortgage backed securities) in the QE programmes since 2008, and the structural decline in the term premium *.
Because the Fed has not been actively managing the duration risk of its substantial MBS portfolio (which reached about 30% of total MBS outstanding at peak), upward pressure on 10 year yields may have been reduced in this tightening cycle since the normal convexity hedging of MBS portfolios has not occurred. In addition, virtually all estimates of term premiums suggest they are at, or near, historical lows. The switch to a low inflation regime appears key in the estimated decline in term premiums since the high inflation regimes of the 1970s and 1980s, when investors required much more protection for holding longer dated fixed coupon bonds.
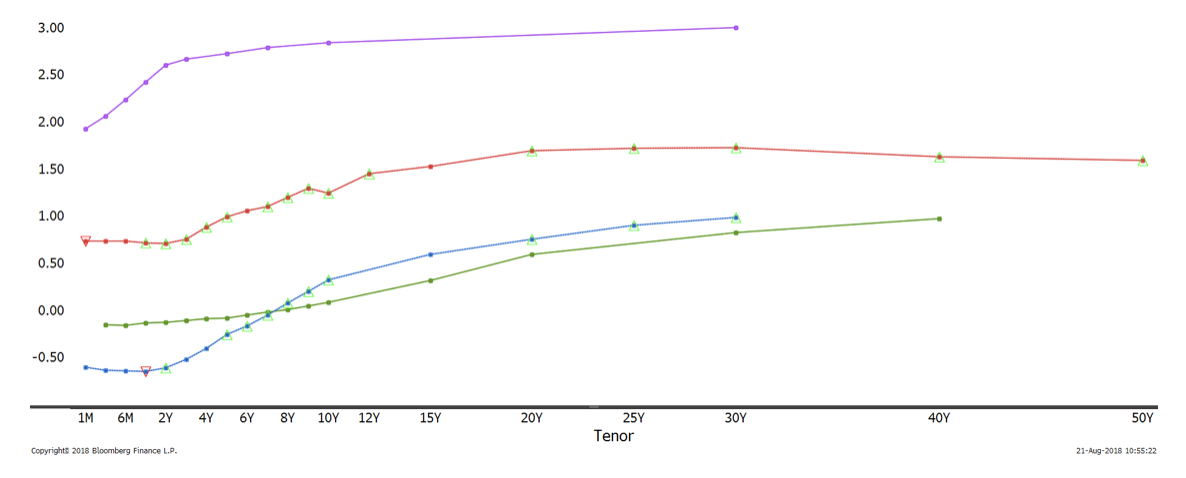
But it would be a bold move to dismiss the yield curve completely as a leading indicator of recessions and weaker growth, even if previous cycles suggest a lag of 8.4 months on average between yield curve inversions and the top of NBER business cycles (Source, NBER & Smith & Williamson calculations). Also note that a comparatively flat yield curve for this stage of the business cycle (mid to late) is not confined to the US. Other G7 bond markets also show structurally flatter yield curves and lower term premiums, reflecting the failure of inflation to rebound strongly after central banks adopted QE programmes and zero interest rates following the global financial crash of 2008/09 (see Chart 2).

Chart 2; Flat G4 yield curves (US, UK, Japan and Eurozone) 21/8/18.
Failure of the term premium to rise in 2004-06, as it had in higher inflation regimes in the 1980s & 1990s, caused the Fed Chairman at the time, Alan Greenspan, to talk of the “ conundrum “ of low long-term yields, and may well have contributed to the Fed overdoing the tightening cycle in short rates. This raises the risk of a repeat in this cycle with some Fed Governors saying early in the current tightening cycle that they would need to tighten more, if the term premium doesn’t rise (NY Fed Chairman William Dudley, 2016). It also seems likely that unless central banks abandon, or adjust, inflation targeting, yield curves are likely to remain structurally flatter, and term premiums lower in future.
G7 central banks have generally conceded future policy cycles are likely to have much lower interest rate peaks than previously, in response to lower inflation, ageing labour forces and weaker real growth, even if they do not fully subscribe to the “ secular stagnation “ view of Larry Summers and Robert Gordon. This has been formalised in forward rate guidance, so the ECB, for example, has made clear that short rates will not increase until Q3 2019. Similarly, the Federal Reserve’s “ dot plots “ show rates peaking at about 3.125% in 2020, which would compare with a previous peak of 5.25% in 2007, and 6.5% in 2000 for Fed funds. This means duration in portfolios is becoming less of a risk in fixed income portfolios than in the 1980s & 1990


