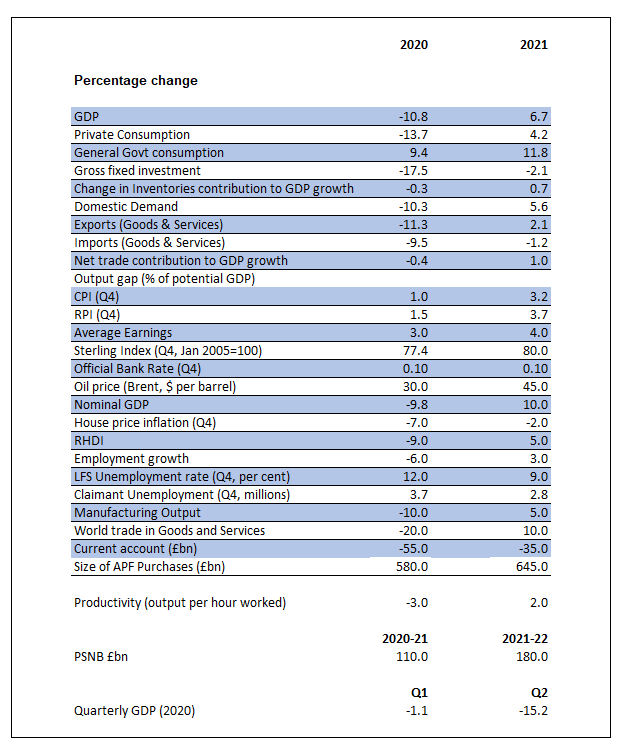
Incredibly, I have been involved in preparing forecasts of the UK economy for 45 years. I have a reputation for making bearish calls – occasionally successfully – but have never produced, or agonised over, a forecast as terrible as the one below. We now expect UK GDP to fall by nearly 11 per cent this year, employment to drop by 8 per cent (notwithstanding the Job Retention Scheme) and public sector net borrowing to climb to £110bn. The forecast error margins are very wide and we will take an unusually keen interest in the next Consensus Economics publication to see how differently others perceive the outlook, not just for 2020 but also for 2021. What is the shape of things to come?
Any attempt at assigning magnitudes to economic variables, even in the near future, is liable to attract ridicule but I maintain that the production of forecasts is an essential activity for professional economists. Rarely, but significantly, we demonstrate an understanding of the interplay of forces in the forecasts we craft. More frequently, our projections reveal our misunderstanding of such forces. And on the few occasions that we hit an outturn on the nail, it is the fortuitous cancellation of errors that delivers our prize.
We forecast not to enhance our reputations nor to assert our prescience: we forecast out of ignorance but in search of understanding. Behind an unwillingness to forecast is an unwillingness to think deeply about the future and how it will differ from the present. Forecasting is a vital form of mental exercise for all applied economists.
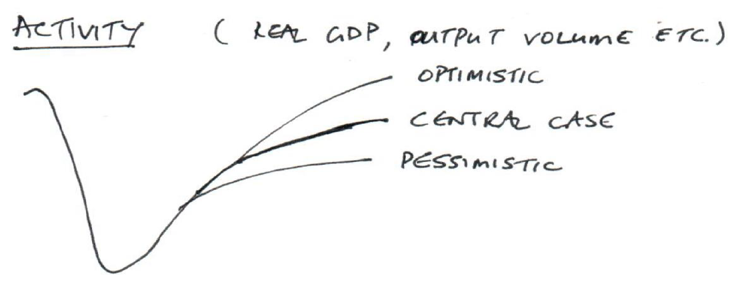
At such a time as this, we must begin with shapes. I have created some crude representations of the potential paths of output and the price level in figures 1 and 2. Please forgive the artwork. These are pure guesses of course, and there are plenty of credible variants. However, the temptation to nuance these paths with additional lumps and bumps should be resisted every bit as much as forecasting to the second decimal place.
Underlying the shape of recovery are critical judgements concerning the resilience of business activities that are currently in lockdown. The best metaphor I have found is that of the ability to hold one’s breath under water. A South African-born friend who once worked as a lifeguard, knew a few hardy souls that could hold their breath underwater for 15 minutes. (The world record is 22 minutes 22 seconds). However, most would struggle to do this for 3 minutes. Every day that passes in lockdown, businesses with weak lung capacity are drowning. A 2-month lockdown is more than twice as damaging as a 1-month lockdown.
There may be salvageable assets that have value, but there are dire consequences for the owners, the employees and the suppliers of such businesses. How much of the business infrastructure of 28 February 2020 will still be there on 31 May? On 30 June? On 30 September? Judgements about the rate of attrition, the available reliefs, the speed of rescue and the degree of debt forbearance will determine how much output is recoverable immediately, how much is recoverable eventually and how much is lost for good.
The shape of the activity profile is difficult enough, but the path of the price level is the more so. When there are multiple demand and supply shocks, literally any outcome is possible. We expect deflationary forces to peter out relatively quickly as the combination of private demand recovery and delayed-effect public spending confronts a depleted pipeline and broken supply chains. On the assumption that local capacity must be created to replace lost import capacity, the more committed the effort to rebuilding this domestic capacity, the stronger the activity recovery and the weaker the price recovery, and vice-versa. Bearing in mind that corporate profitability will be crushed in 2020, how willingly will this investment in new capacity be made?
Figure 1:

The underlying issues on activity are:
1 How far does activity plunge?
2 How long will it take to hit bottom?
3 Will there be an initial phase of rapid recovery?
4 How long will it last?
5 How much of the loss of activity will be recovered in this phase?
6 Once the pace of recovery slackens, how long will it take to recover the starting level of activity?
7 Is there a permanent loss of activity related to a loss of capacity?
Figure 2:

The underlying issues on the price level are:
1 How much deflation occurs?
2 How long does it take to reach a price minimum?
3 Will there be an initial phase of rapid price growth?
4 How long will it last?
5 Will the inflation rate stabilise soon?
6 How quickly will supply constraints be overcome?
7 How will inflation expectations be formed?
Figure 3: Forecasts for the UK economy (as submitted to HM Treasury)

Source: Economic Perspectives Ltd


