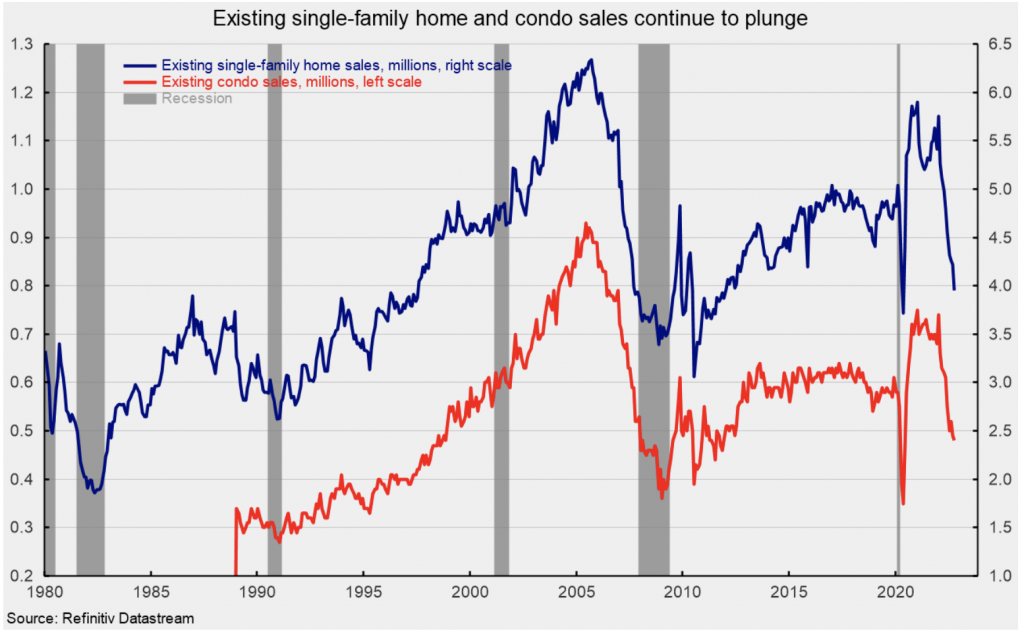
Sales of existing homes sank another 5.9% in October to a 4.43 million seasonally adjusted annual rate. That is the ninth consecutive monthly decline, leaving the selling pace at the lowest level since May 2020, the low of the lockdown recession. Excluding the lockdown recession, sales have been at their lowest since December 2011. Sales were down 28.4%t from a year ago and 31.7% from the January peak.
Sales in the market for existing single-family homes, which account for about 90% of total existing-home sales, dropped 6.4% in October, coming in at a 3.95 million seasonally adjusted annual rate (see first chart). Sales are down 28.2% from a year ago and 31.3% from the January peak. Single-family sales also fell for the ninth consecutive month and were at their slowest pace since the May 2020 lockdown recession.
The single-family segment saw sales decline in all four regions. Sales fell by 4.7% in the Midwest, 5.4% in the South, the largest region by volume, 7.8% in the Northeast, the smallest region by volume and 10.3% in the West. Sales were down double digits in all four regions from a year ago (-38.1% in the West, -26.4% in the South, -25.5% in the Midwest, and -23.0% in the Northeast).
Condo and co-op sales fell 2.0% for the month, leaving sales at a 480,000 annual rate for the month versus 490,000 in September (see first chart). Measured from a year ago, condo and co-op sales were off 30.4% and were at their slowest pace since June 2020.
Condo and co-op sales were down in one of the four regions in October, falling 14.3% in the Midwest, but were unchanged in the Northeast, the West and the South. From a year ago, sales were also down in all four regions (-33.3% in the South, -33.3% in the West, -23.1% in the Northeast and -25.0% in the Midwest).
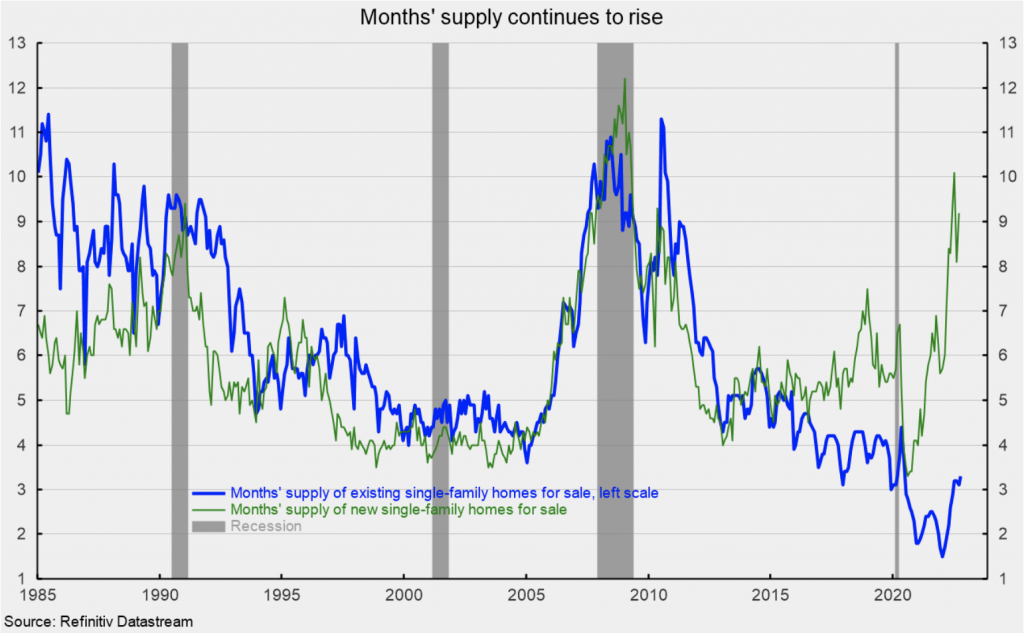
Total inventory of existing homes for sale fell in October, decreasing by 0.8% to 1.20 million, leaving the months’ supply (inventory times 12 divided by the annual selling rate) at 3.3, the highest since June 2020, but still low by historical comparison.
For the single-family segment, inventory was down 1.8% for the month at 1.08 million and is 0.9% above the October 2021 level (see second chart). The months’ supply was 3.3, up from 3.1 in the prior month and the highest since June 2020 (see second chart). The months’ supply for new single-family homes for sale has surged to 9.2 over the past year (see second chart).
The condo and co-op inventory increased 3.8% to 138,000, leaving the months’ supply at 3.5. Condo and co-op months’ supply is 25.0% above October 2021.
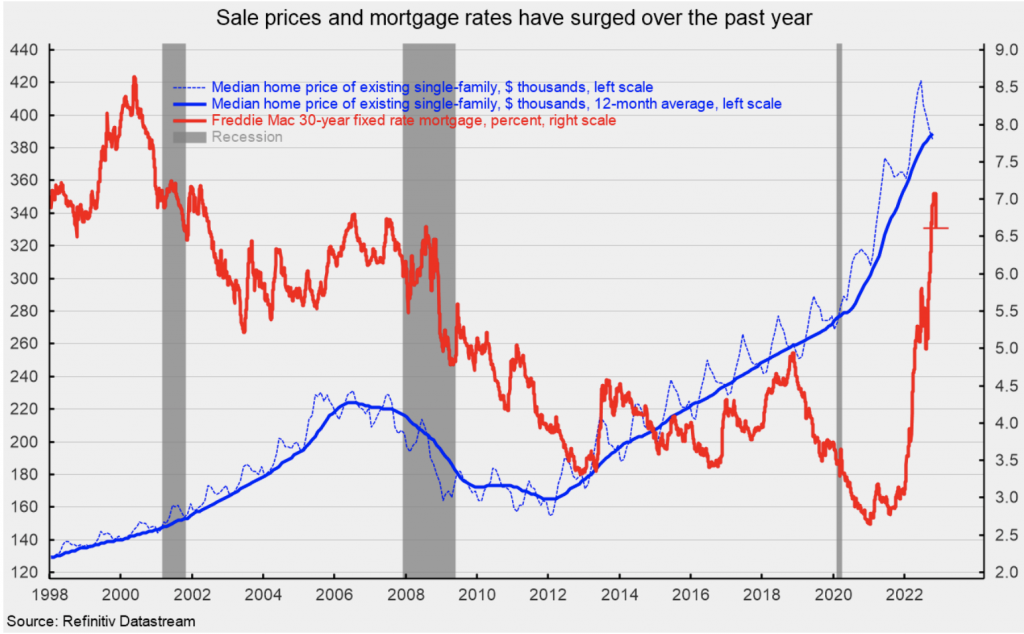
The median sale price in October of an existing home was $379,100, 6.6% above the year-ago price. For single-family existing home sales in October, the price was $384,900, a 6.2% rise over the past year (see third chart). The median price for a condo/co-op was $331,000, 10.1% above October 2021.
Mortgage rates have been surging again recently, bouncing around the 6.5% to 7.0% range in mid-November, well above the lows of around 2.65% in January 2021 (see third chart).
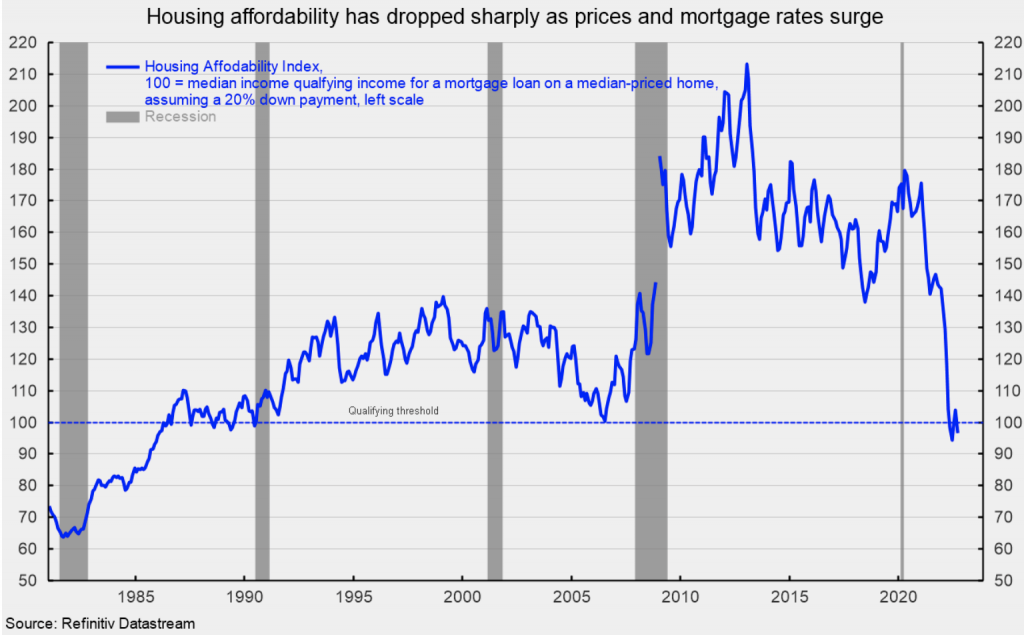
The combination of near-record-high home prices and sharply higher mortgage rates has sent housing affordability plunging. The Housing Affordability Index from the National Association of Realtors measures whether or not a typical family could qualify for a mortgage loan on a typical home. A typical home is defined as the national median-priced, existing single-family home as calculated by NAR. The typical family is defined as one earning the median family income as reported by the US Bureau of the Census. A value of 100 means that a family with the median income has exactly enough income to qualify for a mortgage on a median-priced home. An index above 100 signifies that a family earning the median income has more than enough income to qualify for a mortgage loan on a median-priced home, assuming a 20% down payment. As of September, the index stood at 96.6, below the qualifying threshold (see fourth chart).
Housing is likely to continue to be under intense pressure as near-record-high prices and surging mortgage rates reduce affordability and push more and more buyers out of the market.
Originally published by the American Institute for Economic Research and reprinted here with permission.


