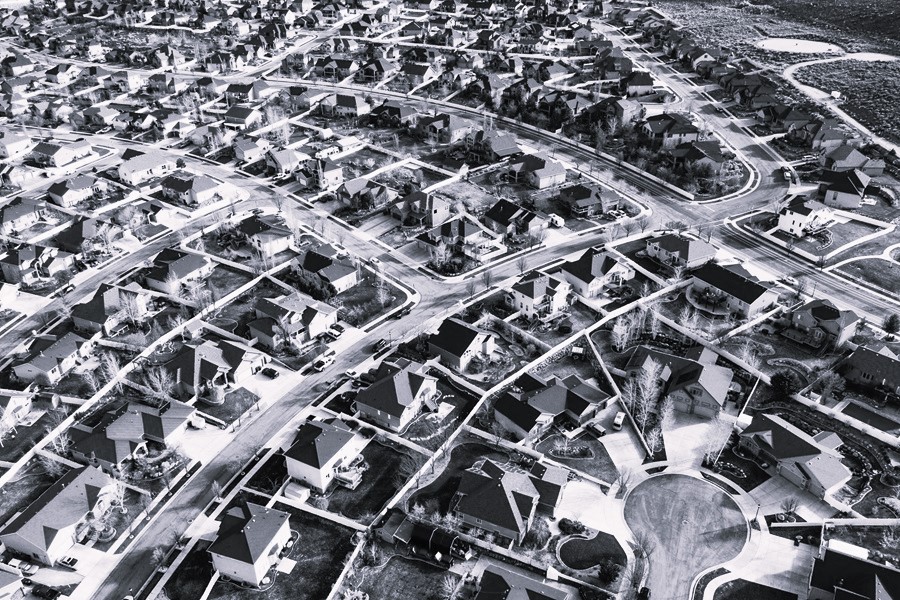
- BREAKING NEWS: researchers have now quintupled the housing shortage!!!
- prices came down
- loving that used-home smell
- small houses, all the rage
Biggest housing shortage of all time(!)
The esteemed columnists and podcasters, Matt Yglesias and Ezra Klein, recently linked to some research that purports to show the “housing shortage” is even bigger than we thought.
We now have the biggest. housing. shortage. ev-er:
“Our housing shortage estimate is 4 to 5 times as large as previous estimates, and 13 times as high as the shortage cited by the White House to contextualize the effects of policies intended to close the gap.”
Nailed it, Bro! Our shortage is 5X bigger than the biggest shortage. Mic drop.
While Random Walk is loath to argue with experts and their science,1 now is as good a time as any to remind anyone who cares to be listening that, in fact, there is no housing shortage, at all.
Nor is there an “affordability crisis,” or anything like that. To the contrary, home values aren’t even going up.
This is well-covered ground for Random Walk, so please consult the backlink for a more thorough debunking of perhaps the grandest myth of our day. For now, I will focus on some charts Bank of America compiled that highlight one feature of the broader “there is no shortage affordability crisis” claim.
In this case, if you want to know directionally where the housing market is going, you got to look at where the action is.
And the action is entirely in the “new homes” part of the market.
You see, when rates went up, existing homeowners could either (a) sell their homes at the depressed prices the market is now able to bear; or (b) not to that, and instead enjoy the freedom of the 30-year fixed-rate mortgage (while their “locked in” lender futilely pounds sand).
Predictably, homeowners chose option (b): ride the 30-year and chill (unless you get the rare all-cash offer you can’t refuse). I mean, why shatter the illusion of an “all time high in home equity,” if you don’t have to?
The result is existing home sales have cratered.
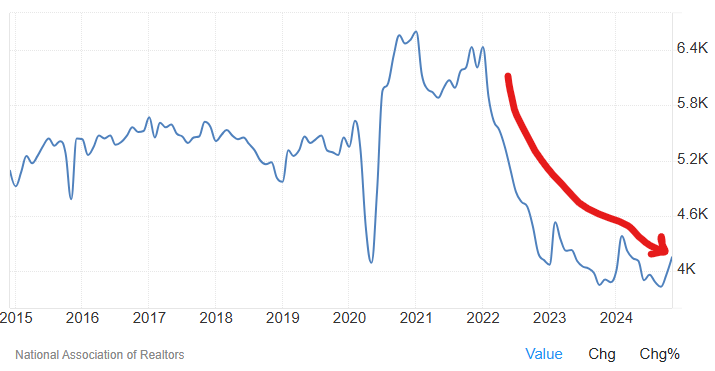
NAR
The Bid-Ask between sellers and buyers is just too wide, so nothing moves (and of course, price indexes don’t capture the trades that don’t happen).
Nothing solves this logjam but time, or retroactively killing the 30 year, and making it float (or a recession, where people need to sell).
None of that dynamic exists, however, with new homes.
Homebuilders aren’t in the asset-appreciation business. To builders, houses are a commodity to build and sell. They don’t have the luxury of simply standing pat and pretending their houses are appreciating—builders have to move inventory, by building and pricing (and discounting) to market.
And so they have. Quite handsomely too, by building cheaper, smaller houses (with discounts aplenty), consistent with the depressed purchasing power (and therefore lower home values) that comes with higher rates.
You see, interest rates are the prime mover here. Not NIMBYS or shortages, or any such nonsense. The supply of homes is just fine. It’s just that the supply of credit is not.
Anyways, on to the charts.
Prices are falling
First, new home prices are declining:
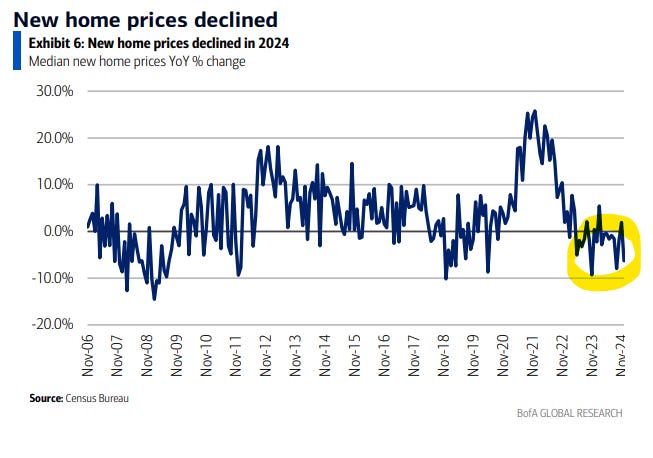
New home prices have been negative pretty much for the last 2 years.
Declining prices is pretty strange for an “affordability crisis.”
Love that lived-in feel
Second, brand new homes are cheaper than used homes:
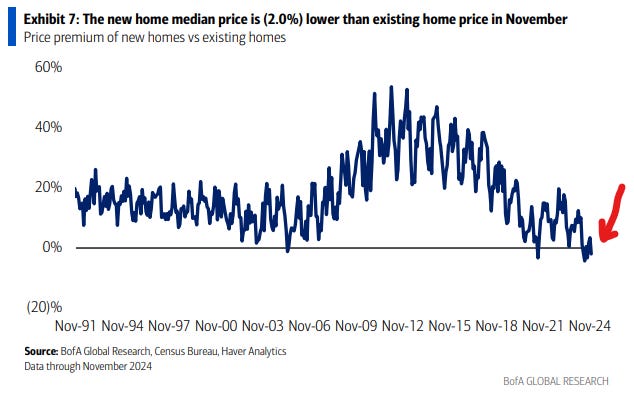
The premium to new homes faded when rates went up, and is now completely gone.
Now, why would brand new homes be cheaper than used homes? Is vintage homeownership oh-so-chic?
No, of course not. Part of the equation is that existing to new is not apples to apples—more on that below.
But more importantly, it’s because the median price of used homes is actually much lower than the “median price” that shows up in the index. The index is derived from the few homes that actually clear, but since it’s not measuring the prices of all the homes that aren’t selling, it’s lying to you.2 In other words, new homes aren’t actually cheaper than used homes—but you can’t measure, what you don’t see.
As Random Walk is oft to observe, most people can’t afford their own homes at the prices they think they’re worth. That tells you everything you need to know about the actual value of their homes.
Smaller homes are all the rage
Third, new homes are getting smaller:
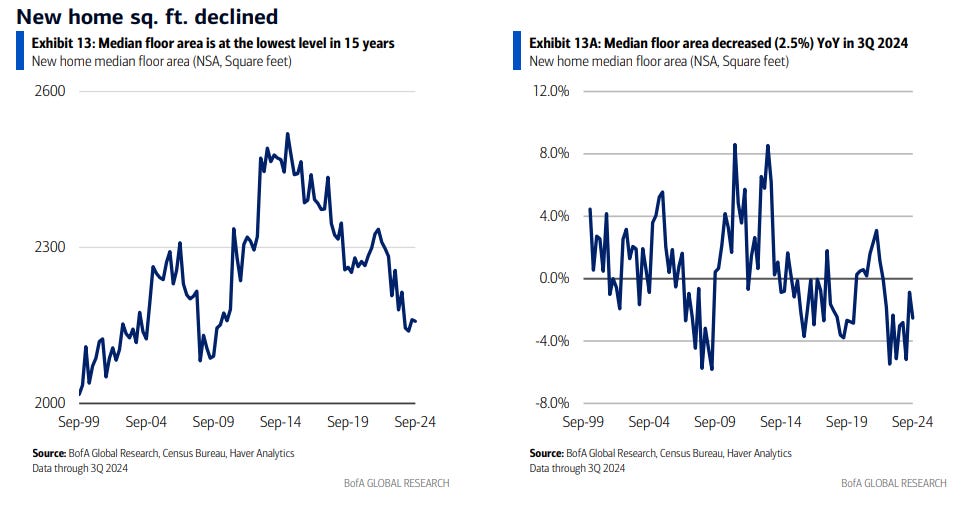
Median floor area of new homes is smaller than its been in ~15 years, since right after the Global Financial Crisis.
Now, if “affordability” was driven by a “shortage,” (and if home equity value is at an “all time high”) then why would new homes get smaller and smaller? And why does the size of homes seem to fluctuate in accordance to interest rates, getting smaller as rates go up, and bigger when rates go down?
Obviously because there is no shortage.
The reason that houses have gotten smaller as rates went up, is because people can only afford less house (and there are fewer families needing houses, anyway).
The point is that homebuilders are telling you where home values go when the cost of credit triples: home values go down. No ifs ands or buts about it.3 You might have the luxury of denial, but that doesn’t make it any less true.
It’s interest rates, not land use regulations, that are the straw that stirs the drink.
Obviously.
But, we just 5xed our shortage, bro, the research shows, so just shut your Random Walk face.
Alright then.
This article was originally published in Random Walk and is republished here with permission.


