


Too high? Too low? Just right? What do Real Estate, VC and PE have to say for themselves?
We’re back. One victory lap, one ‘more of the gloomy same,’ and one green shoot of Spring.
- home values are not so high (says the smart money, and not just Random Walk)
- VC asset values are not so high (or at least, someone is very wrong about marks)
- PE asset values . . . getting to just right?
Home values are not so high
Longer-term Random Walk readers know the deal on home values.
- there is no housing shortage; and
- home values are not going up (despite what indexes appear to show)
Without rehashing it all here, the tl;dr is that interest rates are the straw that stirs the housing drink.
- When rates are low, values go up.
- When rates go high, values go down.
It’s that simple.
Of course, that owners have the 30-year luxury of holding (rather than selling) means that fewer transactions clear at prevailing market prices, and therefore losses stay “unrealized.” That creates an illusion (for some) of an “affordability crisis,” when, in fact, we have a “bid-ask crisis,” if any crisis, at all.
This should be obvious, but people get very emotional when it comes to housing, so it stays edgy and contrarian.
Anyways, the good news is that it’s perhaps not so edgy or contrarian, at least when money is where the mouths are.
For the publicly-traded single-family landlords, Invitation Homes INVH 0.00%↑ and American Homes 4 Rent AMH 0.00%↑, investors aren’t buying the “all time high in home values” canard.
Investors are instead discounting the value of their single-family inventory by 20-35% (at least according to Green Street).
In other words, if you took all the single-family homes that Invitation and AMH owned, and then multiplied them by their respective index-values, you could come up with a number for what those homes are worth in-total—let’s call it “net asset value.” That NAV should be reflected in the value of those companies.
And so it is, but in this case, investors are saying, “yeah, but we think the actual value is a lot less than that.”
For Invitation Homes, the discount is especially stark:
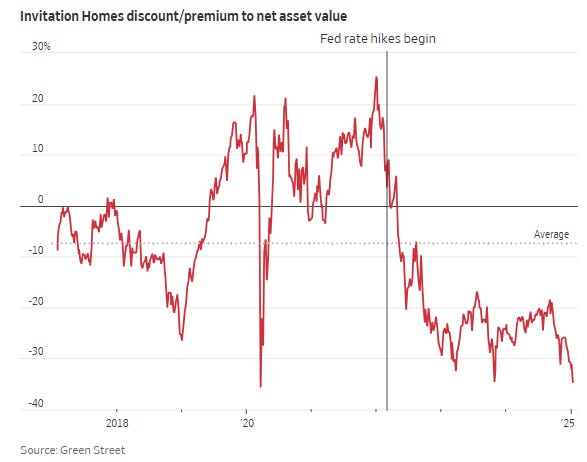
Invitation Homes discount to NAV is ~35%.
As per the WSJ:
“Put another way, while the average house in the metro areas where Invitation Homes owns its properties sells for $415,000 . . . the company’s share price implies that investors think $310,000 is more appropriate . . .
“‘Share prices are signaling that single-family-home prices are too high and are not sustainable,’ says John Pawlowski, a managing director at Green Street. However, he points out that home values can remain disconnected in public and private markets for longer than for commercial real estate because prices are set by owner-occupiers rather than investors.”
It’s not that home prices are too-high, so much as “the average” price derived from historically low volume of sales is not actually the average price, but that’s just a quibble.
The point is that smart money is telling you where home values have been going, and the answer is not “up.”
Indeed, the WSJ points out what Random Walk pointed out many moons ago: smart money is out-the-game:
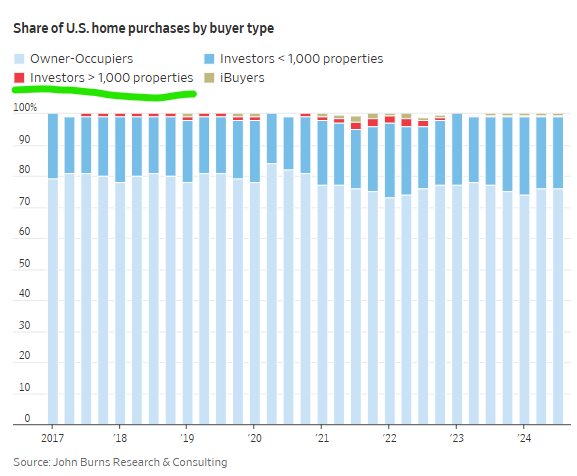
Owners of 1,000+ properties haven’t bought a meaningful share of homes in over two years, or since rates went up.
So, the big investors in single family homes don’t even register as buyers anymore, but sure, home values are higher than ever.
Smart money knows what’s up.
VC asset values (still) too high
Random Walk (and by now, everyone) has written at-length about the correction underway in private capital, and VC specifically—it’s yet another thing, that I will not rehash in full.
Suffice it say that while I’m always on the lookout for green shoots, or something new and different to say, the story largely remains the same: it’s tough sledding out there.
Too many companies were funded with too much money, and now that higher rates have repriced those assets substantially lower (because, as per above, that’s how it works), they cannot be sold (or raise more money) at prices that will generate returns for investors.4
And so, VC have struggled to generate returns, and therefore have struggled to raise new funds, and therefore have struggled to write checks to startups. A “right-sizing” correction is well-underway, which is painful, but also presents opportunities of its own.
Anyways, while, I might have a few more things to say as full-year 2024 data trickles in, I found this chart (while not new n’ different) to be both striking and illustrative of the overall setup (which is still pretty gloomy, in the main):
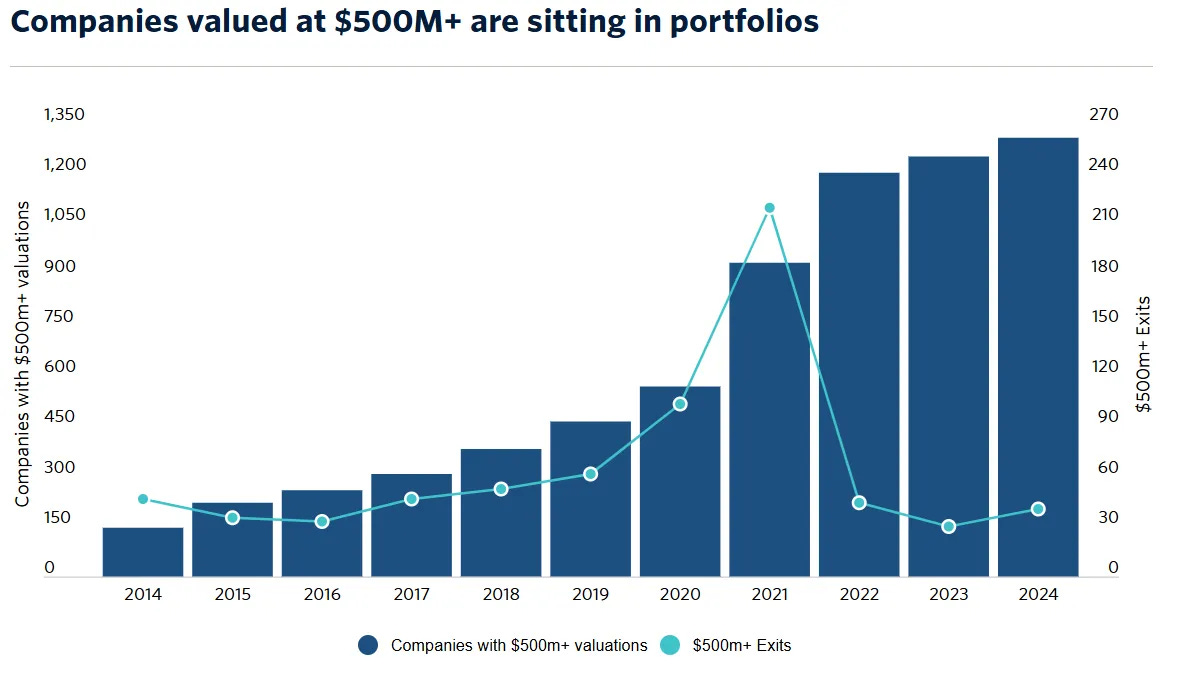
While the number of $500M companies is at an all-time high (and growing), the number of $500M exits is at 2016 levels.
Or more precisely, while there are ~1,300 companies valued at $500M+ currently held by VC, the number of VC-backed companies that have actually sold for $500M+ is 40.
Now, 40 is slightly more than the 30 in 2023—so that’s good—but otherwise, you have to go back to 2016 to find fewer $500M+ exits (and the asset class was a lot smaller then). That’s not so good.
Look, it doesn’t take a genius to figure out what happened here (and it’s why I like the chart): 2021 was a banner year, and VC raised (and deployed) a lot, a lot of money off of that success.
And then the tides went out. Those valuations though, still look nice on paper.
PE asset values, just right?
Last one before we go, and this one is cheerful.
As per above, it’s been tough sledding for both VC and PE. The No Exits and no fundraising dynamic that’s been true for VC has been true for PE, as well—and interest rates (or the sudden change), are a prime culprit.
Likewise, Random Walk has raised many an eyebrow at PE asset values, and duly noted all the nifty maneuvering that PE sponsors (and their related-lenders) have performed to keep their ships afloat.
That said, things have been looking a little better for PE lately (or at least stable).
Q4 turns out to have been a busy quarter for PE exit activity:
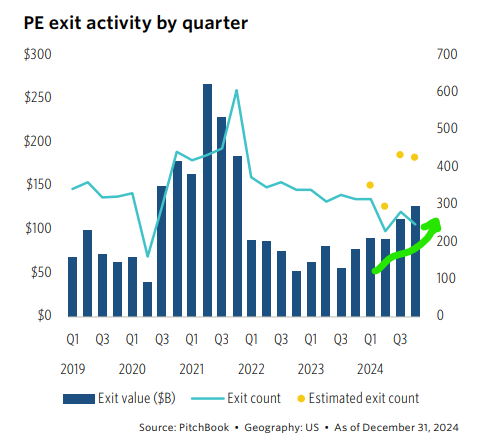
A flurry of exits towards year-end, turned 2024 into a pretty good year, for pre-pandemic standards, at least.
Again, a return to the status-quo ante isn’t going to cut it, considering all the outsized activity of the ‘21-’22 period, but it’s still an improvement.
That’s not the interesting observation though.
This is a post about valuations, and the interesting thing is that valuations appear to be getting healthier.
For buyout funds, at least, the gap between portfolio valuations and actual exit valuations is all but gone:
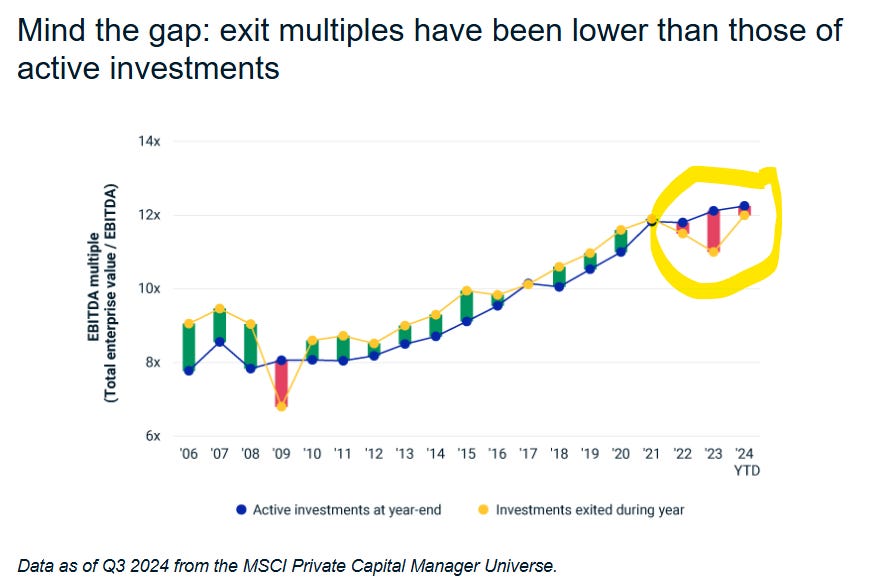
Exit multiples for buyout funds—as a multiple of earnings—are now just 0.3x smaller than the valuations for those companies still held on the books.
“For the third year in a row, exits have occurred at lower valuation multiples (total enterprise value/EBITDA) compared to those still held by funds, a gap not seen in buyout investments since 2009 and the GFC.
“The pricing gap has narrowed to a mere 0.3x in 2024 through the third quarter, however.”
The gap between PE marks, and the prices they could actually fetch, reached a post-GFC high in 2023, so this is improvement.
If I understand this correctly, what it means is that PE people are now valuing their companies just a tad more than what the market will pay for them.
Obviously, you want exit multiples to be higher than private marks, which means there’s still some work to be done (and again, selection effects abound), but still, the trend is right.
And compared to the chart of $500M+ companies above, the trend is a walk-in-the-park.
Plus, this is Q3 data, and Q4 was the banner quarter for exits, so perhaps exit valuations are already in the money.
This article was originally published in The Random Walk and is republished here with permission.


