Many farming and food companies are investing or plan to invest in improving the sustainability of food production. This Craigmore commentary, the second in a three-part mini-series, examines the strategies of food companies and farmers to improve their environmental footprints. While sustainability is a much broader topic, this series focuses on strategies to reduce greenhouse gas emissions and climate change mitigation.
This article looks at the greenhouse gas efficiency of farming systems and then at specific initiatives under way in the food industry to reduce net emissions using Map of Agriculture, a Craigmore established farm data platform, as a case study. While each article in this three-part series stands alone, the three parts combined go further into the full breadth of the topic.
Are some farming systems better than others?
Day- and night-time temperatures, rainfall, irrigation, evapotranspiration, sunlight hours, altitude, latitude, soils and many other factors mean that crops in some places grow two or even four times faster or more resource efficiently than in others. In economic terms this means average ‘factor efficiencies’ (per unit of land, water, fertiliser or other input) vary widely between farming regions, which leads to economic and environmental comparative and competitive advantage.
For example, there is no better place on earth to grow soya beans than the plains around Buenos Aires, while Iowa is almost perfectly suited to growing corn (maize). And kiwifruit, apples, radiata and pastoral dairy cows are most productive on the islands of New Zealand.

Readers will have their own view on whether NZ Sauvignon Blanc falls into the same world-beating category, but you get the idea. I often explain to investors that farms produce commodities, but land itself is not a commodity. Each farm or forest is a unique claim on nature’s bounty.
Environmental intensities correlate with factor efficiencies. Thus, some farming systems and locations can emit far less greenhouse gas per calorie of food than others. Research from Lincoln University has found that, from paddock to plate, NZ dairy products have half the carbon footprint of locally grown European products, even after adjusting for transport costs (sea freight is cost efficient and has a low carbon footprint), while NZ production of sheep meats is more efficient still. A recent study from the Auckland University of Technology found that woody vegetation on New Zealand’s sheep and beef farms already offsets between 63% and 118% of their on-farm agricultural emissions (mid-point of 90.5%).
If this is correct, it follows that not all pathways to lower emissions need to be high-tech (although these will help, and examples are discussed below). Many gains can be made simply by accurately measuring the factor efficiencies of farms and rewarding those growers that can combine fewer inputs (and so less pollution) per unit of food. With all calculations adjusted, of course, for emissions from transport to the ultimate consumer.
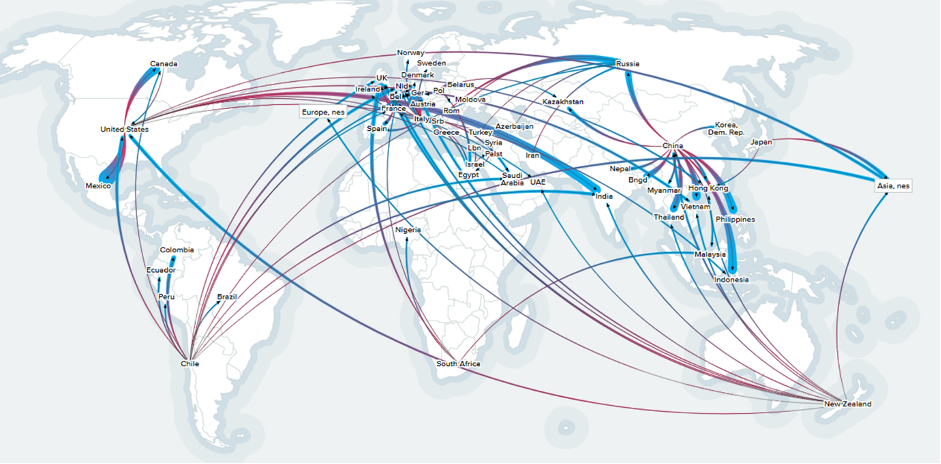
Craigmore pointed out in our April 2020 commentary that approximately 25% of world food crosses a border before it is consumed (the graph on apple trade below is an illustration). Further, this ratio has been steadily increasing, with co-benefits to general food security and nutrition.
Trade in fresh apples (by US$) 2018

This trend can be expected to continue as the low emissions footprints of some farming regions help food brands and retailers meet their targets for emissions reduction.
What is Map of Ag doing to help food retailers and food brands shift their footprints?
Map of Ag is a £6m-turnover platform that helps more than 50,000 farms share data with service providers as well as processors, food companies and retailers. Map of Ag is experiencing a growing urgency among its agri-food clients to better define, measure and manage on-farm sustainability.
Map of Ag’s CEO, Richard Vecqueray, estimates that while support for sustainability (including animal welfare) contributed one-quarter of Map of Ag revenues two years ago, this will soon exceed 50%. Furthermore, food brands and retailers have not slackened their commitments during covid-19. Hugh Martineau, head of sustainability at Map of Ag, says “the sustainability commitments by firms in the food value chain have, if anything, been accelerated by covid”.
Map of Ag helps groups of farms with benchmarking of outcomes, often in real time – for example harvest logistics, animal welfare, soil, water and energy KPIs. Agri-food companies (including a number of those whose emissions commitments are summarised in the first piece in this series) employ Map of Ag to establish baselines such as greenhouse gas emissions intensity and to shape roadmaps to meet future targets.
In 2020 farming, as an essential industry, has carried on bravely and largely unaffected by covid-19 in most regions and sectors. However, this is less true for farm service providers, which have in some cases been disrupted. Auditors for the 40,000 UK farms that are members of the Red Tractor farm assurance standards were unable to visit farms from early March this year. Map of Ag was able to help Red Tractor plug this gap by making farm remote observation and data capture tools available to an average of 1,000 new farms each month. Interestingly, both farms and food companies still want a human involved in the assessments. Hence, the many documents reviewed by the auditor are now transferred to them over the platform rather than in paper form. Farm visits are now able to be conducted by the camera on a farmer’s smart phone, with the farmer moving around the farm as directed by the assessor.
The next article in this three-part mini-series will look at specific initiatives under way in farming to reduce emissions using Craigmore’s own farms as case studies.


