Ordinary valuation methods prove inaccurate when the measures they’re based on are in such a state of flux – it’s time to turn to a different methodology.
In ordinary circumstances (anyone remember those halcyon days of steady state equilibrium?) the task of valuing a REIT was relatively straightforward. All that was required was a forecast of the REIT’s key per-share measures (EPS/AFFO, DPS and NAV) for the next two years, and a target price methodology derived from explicit assumptions. From there a forecast-based recommendation was fairly straightforward. With relatively high levels of occupancy the key driver would be market forecasts for the asset type adjusted for company-specific factors such as leverage/size of the development programme and acquisitions/disposals.
In the current environment all three measures have become subject to an unprecedented level of variance. Wildly uncertain income from quarter to quarter as tenants can’t or won’t pay contracted rents affects EPS/AFFO; a relaxation of requirements regarding dividend payments affects DPS projections; and low transactional evidence provides an uncertain yield movement which affects NAV forecasts. As a result, market analysts must feel as if they are required to attempt six impossible things before breakfast.
However, there is an answer that, while obviously not perfect, allows for some rationalisation of the only certain variable in the current equation – the share price – and enables us to compare what is assumed in the share price with our best guess. The caveat is that this model uses mean reversion (adjusted if required for structural changes) and clearly has limitations where there is a binary outcome to refinancing (such as with Intu/Hammerson). That said, the assumptions are less heroic than required for CAPM, or, frankly, as naïve as those used in the Gordon Growth Model.
The fundamental concept is that when markets are in disequilibrium it can be difficult to have explicit forecasts. In these circumstances we use implicit forecasts – based on the valuation of historic per-share figures. The share price is making certain assumptions about future growth (typically negative in the present case of real estate). By using mean reversion techniques, we can calculate the implied growth rate. We can then compare that implicit growth with our own estimates and produce a target price and recommendation this way.
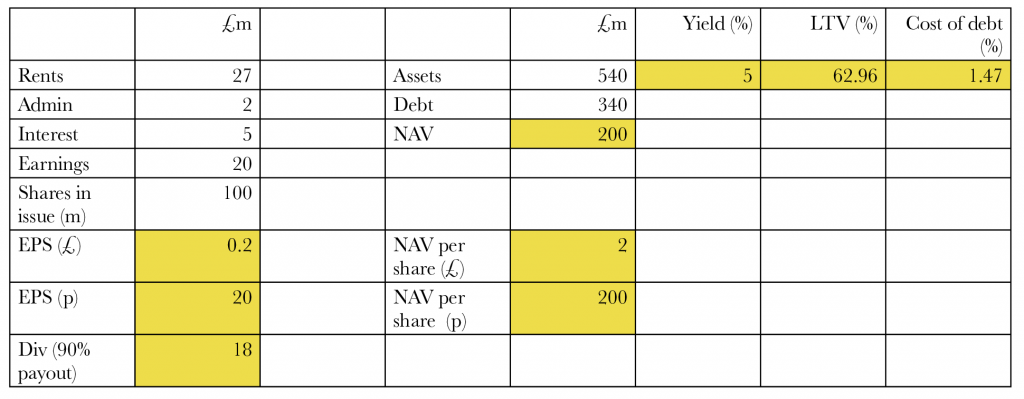
The example in the table below shows how this concept works (for illustration only; it may not be 100% realistic).
Using this implied forecast methodology allows us to at least compare a reasonable assumption of what the share price is implying with our own explicit forecasts. The key assumptions are obviously that the business is a going concern and that the capital structure will not be the primary driver of the share price. Using this method also connects the public and private markets by allowing us to understand how much values are forecast to change relative to the last appraisal.
Using implied pricing to produce a target price
STEP 1: THE PRINCIPLE
When calculating a target price you alter the multiple/dividend yield/premium or discount to NAV and keep the forecasts unchanged. For implicit pricing you alter the forecasts to achieve long-term average valuation ratings and compare the change with the historic figures.
What you need:
1) share price;
2) estimated historic average of valuation measure for the company – for this you could use the EPRA discount to NAV data and a dividend yield chart as a guide (earnings yield = 1.1 dividend yield; multiple =1/earnings yield).
STEP 2: EXAMPLE – all arbitrary figures in this case

STEP 3: VALUATION

STEP 4: CALCULATE per share metrics on long-term average valuation

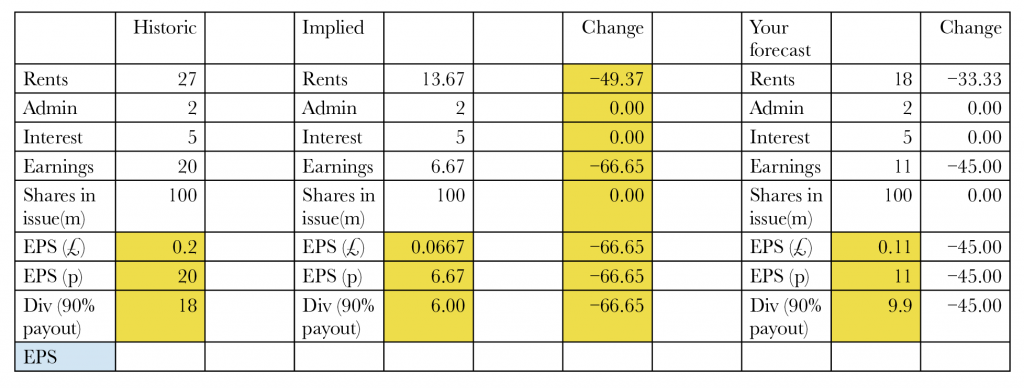
STEP 5: COMPARE implied per share metrics vs actual

STEP 6: DETERMINE HOW MUCH rents and property values have to fall to produce these EPS and NAV numbers

You know shares in issue are the same as is admin and interest.
Therefore earnings will equal 100m shares in issue x £ 0.067.
Earnings are £6.67m.
Rents will therefore be £6.67m plus interest £5m plus admin £2m = £13.67.
Therefore share price assumes rents will fall by circa 50%.
Do you think this is pessimistic or optimistic?
You might think they’re only going to fall by a third (33%).
If you put those figures in you produce an EPS of 11p.
On the long-term average of 15p this would give you a target price of 165p.
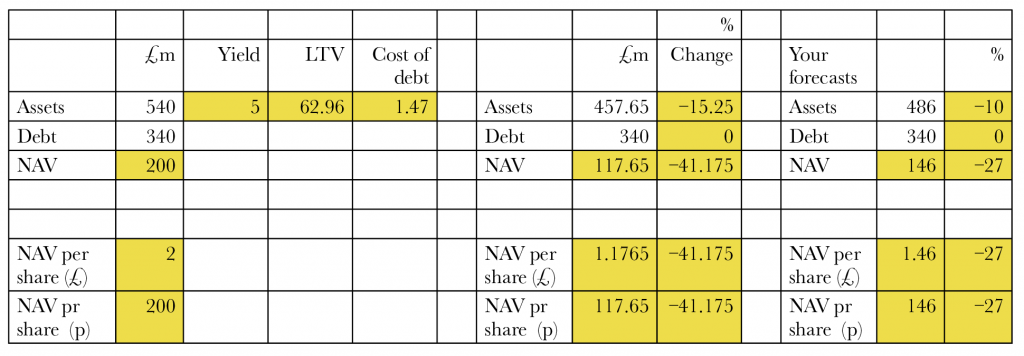
Property values

You know the share price is implying an NAV of 117.65.
Shares in issue are unchanged so NAV is £117.65m.
Debt is unchanged so assets are £117.65m + £340m = £457.65m.
Because of the leverage, notice it only takes a 15% fall in values to result in 41% decline in NAV.
You might think values are only going to fall by 10%.
In this case the NAV would be 146p and your target price would be a 15% (long-term average) on that ie 124.1p.


