Originally published winter 2019.
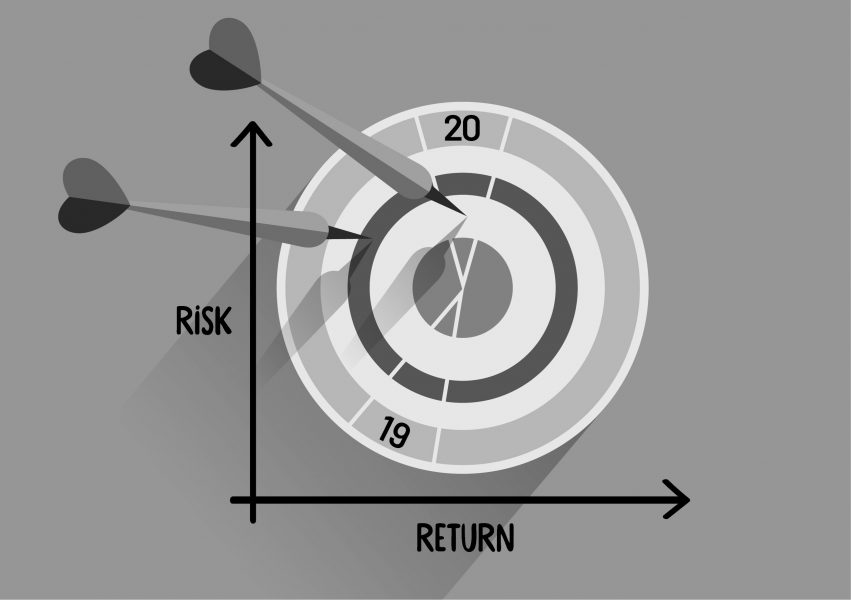
A player’s three-dart shooting average offers a clear metric that can be analysed to reveal the best strategic options – investment management has parallels.
Statistically, if a player’s three-dart shooting average is less than 80, they should aim at treble 19 rather than treble 20. In practice, amateur dart players usually average less than 80, but the vast majority still aim for treble 20. The three-dart shooting average is a simple, transparent, quantitative metric, the analysis of which can reveal strategic options that can lead to better outcomes. Is there an equivalent measure in real estate? If so, how can it be calculated? Can this measure also allow managers to communicate to investors how they intend to either deliver this return or even exceed it?
In darts, the player’s ‘return’ is a score, while in property investment, the investor’s return is from the cash flow. This cash flow is driven by the initial rent, rental growth, leases, costs and vacancies. Market pricing of these cash flows should therefore reflect differentials in expected future growth rates, costs and vacancies between markets and properties within markets. The market pricing of shopping centres, for example, has been marked down as growth expectations have fallen and higher expected future vacancies and costs are factored in. Industrial pricing, by contrast, has risen as a result of higher growth expectations and more optimistic cash flow assumptions for tenant retention and letting periods.
The impact of these changes in expectations can be approximated by the MSCI yield impact measure. Over the last three years this has recorded a yield impact of -16% for UK shopping centres and 19% for UK standard industrials. Coupled with the differential in market rental value changes, this has resulted in a 21% fall in shopping centre capital values compared with a rise of 34% in standard industrial capital values. In other words, the change in pricing (or expectations) had a bigger impact on capital values than the actual change in rental values to date. The change in yields therefore reveals only the impact of changing expectations and we are left to guess what is driving this change. We can make no judgment as to whether the change is justified or overdone.
Source: MSCI
Calculation of the expected return has parallels to throwing darts. Just as a throw point average is the aggregation of multiple scores, every property investment has multiple possible cash flows, depending on whether breaks are exercised, leases are renewed, tenants stay solvent, and the length of any resulting vacancy periods. The calculations are straightforward, although they require a computer model to crunch the numbers. The results are as easy to understand as a dart player’s shooting point average: sectors with longer lease terms, shorter letting periods, stronger covenants and higher expected growth will generate higher cash flows and should be priced accordingly.
Some investors will have the equivalent of a higher shooting point average due to stock selection or active management skills. Such investors are able to pay the market price, as though the properties will achieve the average cash flow for the sector, and then extract a higher return. These skills can be identified and communicated in terms of the cash flow drivers: higher tenant retention, lower letting periods, higher growth or lower irrecoverable costs. The goal of the researcher is also more defined: to identify links between the cash flow drivers and exogenous factors like demand and supply, and to quantify their impact on the cash flow.
Why do most amateur dart players still shoot at 20, despite the maths? Possibly it is just vanity, or a misplaced confidence that their three-dart shooting point average is higher than it really is. Possibly it is because the variation between any two throws at 19 or 20 is likely to be very wide and the mean difference will seem meaninglessly small. Despite the wide variation in the individual dart throws, and between the cash flow outcomes for individual properties, the law of large numbers proves that in the long run the mean is more important than idiosyncratic variations. In investment this is embodied in the portfolio effect. The portfolio effect generates an aggregate cash flow that will tend towards the sector mean. The more properties are held, the more likely that the mean cash flow is achieved.
But what of risk? Are two investments that are priced to deliver the same expected return of equal attraction? The answer depends on our investment objectives and the penalties of not achieving them. In investment, there is always a risk in a downswing that the rent received will be lower than expected. The wary investor will adjust the price that they are prepared to pay for this risk, with riskier cash flows discounted at a higher rate than more secure cash flows. The adjusted price will ensure that investments with a greater downside risk compensate investors with a higher overall return. The amount of compensation required depends on the penalty for not achieving the expected return, such as not being able to meet pension liabilities, not meeting the repayments on a loan or being sacked by an unhappy client for significant underperformance of the wider market.
The source of this risk is not an unsteady throwing hand, but that in a downswing rents will fall and vacancies rise as tenants are more likely to become insolvent, exercise breaks and vacate at lease expiry. So, which markets have riskier cash flows? Are some properties in a market riskier than others? The answer should affect the prices that investors are prepared to pay for properties and their ability to price this risk for their clients. Real Estate Strategies is compiling a dataset of lease events across European markets so that investors can calculate both expected returns and risk scores. The dataset required is large and requires multiple contributors, so please get in touch if this is of interest.


