Impacts fast, recoveries slow
Just as tornadoes, earthquakes, and floods quickly change urban landscapes, so too economic disruptions, erratic business cycles, and pandemics impact real estate expectations and forecasts. Black swan events arrive unexpectedly whereas recoveries from such events are generally slow.
Top down disruptions impact commercial real estate investors, developers, and lenders as price discovery is fluid and continually influenced by incomplete information and mixed beliefs about the future. Market participants seek to understand current events as they unfold and attempt to reasonably predict future outcomes. One rational response is to increase the role of bottom up analysis to counteract top down distortions and improve decision-making processes.
This article examines differences in U.S. retail and office real estate cycles, comparing alternative forecasts to
Retail and office market forecasts…what changed?
Over 300 markets were initially evaluated using a proprietary cycle model that: (a) identifies cycle phase positions in 2022 for each retail and office market, (b) summarizes the retail and office stock for each cycle phase, and (c) calculates the percentage distribution of stock across five cycle phases.
Slippage is a consistent pattern discovered for most of the retail and office markets analyzed. Whereas the Initial forecast may indicate a market improving through 2022 with positive net absorption, declining vacancy rates, and increasing rents, the Revised forecast now shows that same market with negative net absorption, increasing vacancy rates, and decreasing rental rates.
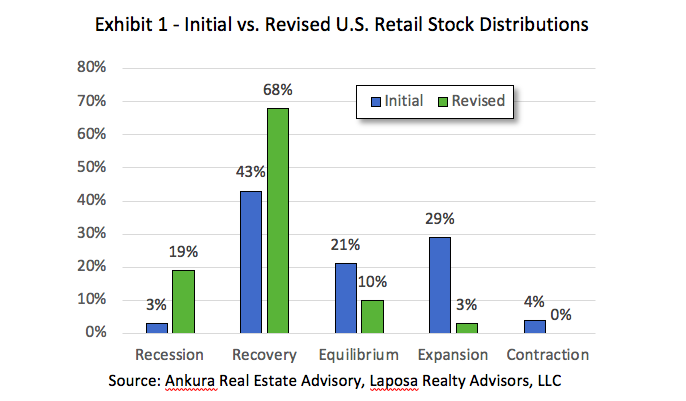
Exhibit 1 illustrates comparisons between Initial and Revised 2022 forecasts for U.S. retail markets. The results confirm significant changes with increases in recession and recovery phases by 2022 and reductions in equilibrium and expansion phases.

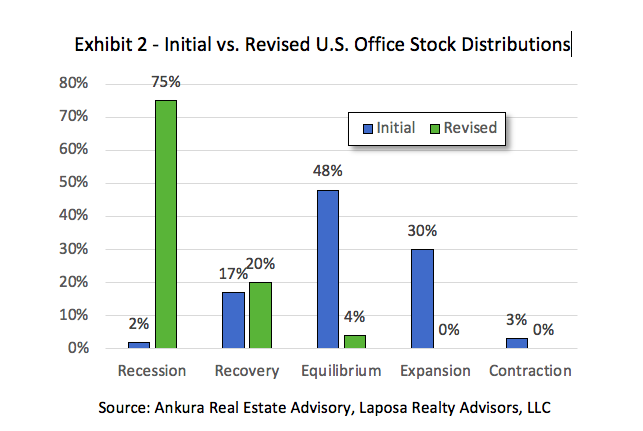
Exhibit 2 compares Initial and Revised 2022 forecasts for U.S. office markets with noticeable change in the percentage of office markets in the recessionary phase chiefly explained by slippage of several large office markets (Atlanta, Chicago, Houston, Los Angeles, New York, and Washington D.C.).

Bottoms Up!
Until today’s creative destructive forces fully run their course with retail and office markets, here are four bottom up recommendations to embed in due diligence and valuation methods:
- Advance the use of trade area and spatial analysis– GIS applications and technology have exploded over the last several years and include new and extensive demographic, business, environmental, aerial photography, and economic variables to elevate current practices. Propensity to order online indices for user-defined geographies and mobile location data analytics, for example, extend typical retail and office market analysis methods. Investigate new artificial intelligence, machine learning, and big data technologies suitable for commercial real estate.
- Scrutinize peer group selection– past peer group selections may not be appropriate peer groups of today or tomorrow due to significant changes such as store closures, renovations, bankrupt tenants, rent concessions, or occupancy levels. Third-party real estate information providers include broad filters such as size, age, occupancy, rents, property type, grade classifications, and geography to support rational peer group selections.
- Know your tenants and industrial classifications – Not all retail and office tenants have fared equally in 2020 and differ in economic disruptions and outlooks. Timely surveys on detailed employment data and consumer preferences on online, buy-online-pickup-in-store, and brick-n-mortar retail shopping preferences are useful to support DCF models, estimate reasonable lease renewal probabilities, net absorption, rent deferrals, and defaults.
- Adjust sale and income approaches– the reduction in the number of transactions and sale volumes challenge identification of sufficient and appropriate sale comparables. Most likely, investor and lender compositions, or who is actively buying, selling, and lending during top down disruptions, impact pricing, valuation, and mortgage rates. One remedy is to interview buyers who purchased prior to the disruption and ask them if they were buying the same property today, what cap rates, leasing rates, rent and expense growth rates, and net operating income assumptions would be used and how do they differ from the original acquisition.
This analysis is not intended to portray a doom-n-gloom scenario for U.S. retail and office markets. The 2022 forecast models include a severe downturn bias and thus expose downside risks and valuation trends. As Dale Carnegie reminds us, “first, ask yourself: what is the worst that can happen? Then prepare to accept it. Then proceed to improve on the worst.”
Top down disruptions increase the role of bottom up analysis but do not eliminate top down analysis nor opportunities. The objective is to create a holistic process that combines national, regional, and city analysis (top down), with submarket, peer group, relevant comparables, and trade area analysis (bottom up) that produces applied and creative insights for investment, asset management, and lending strategies.
Even the authors of This Time is Different acknowledge that this time truly is different[1]. Creating scenarios for the ‘new normal’ are just as unpredictable as black swan events. Most likely, developers, investors, lenders, and appraisers will be able to look back from the future and discover not a new normal but a new equilibrium that is, at best, different from the past and at the same time fragile.
[1]See Carmen Reinhart [accessed 31 July 2020].


